Panera Bread 2005 Annual Report Download - page 42
Download and view the complete annual report
Please find page 42 of the 2005 Panera Bread annual report below. You can navigate through the pages in the report by either clicking on the pages listed below, or by using the keyword search tool below to find specific information within the annual report.-
 1
1 -
2
-
3
-
4
-
5
-
6
-
7
-
8
-
9
-
10
-
11
-
12
-
13
-
14
-
15
-
16
-
17
-
18
-
19
-
20
-
21
-
22
-
23
-
24
-
25
-
26
-
27
-
28
-
29
-
30
-
31
-
 32
32 -
 33
33 -
 34
34 -
 35
35 -
 36
36 -
 37
37 -
 38
38 -
 39
39 -
 40
40 -
 41
41 -
 42
42 -
 43
43 -
 44
44 -
 45
45 -
 46
46 -
 47
47 -
 48
48 -
 49
49 -
 50
50 -
 51
51 -
 52
52 -
53
-
54
-
55
-
56
-
57
-
58
-
59
-
60
-
61
-
62
-
63
-
64
-
65
-
66
-
67
-
68
-
69
-
70
-
71
-
72
 |
 |

36
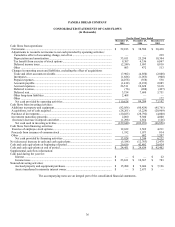
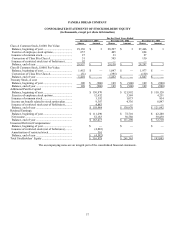
PANERA BREAD COMPANY
CONSOLIDATED STATEMENTS OF CASH FLOWS
(in thousands)
For the Fiscal Years Ended
December 27,
2005
December 25,
2004
December 27,
2003
Cash flows from operations:
Net income ........................................................................................................................ $ 52,183 $ 38,580 $ 30,430
Adjustments to reconcile net income to net cash provided by operating activities:
Cumulative effect of accounting change, net of tax ...................................................... — — 239
Depreciation and amortization ....................................................................................... 33,011 25,298 18,304
Tax benefit from exercise of stock options .................................................................... 9,307 4,336 6,847
Deferred income taxes ................................................................................................... (2,249) 5,993 8,810
Other .............................................................................................................................. 803 472 513
Changes in operating assets and liabilities, excluding the effect of acquisitions:
Trade and other accounts receivable.............................................................................. (7,902) (4,850) (2,808)
Inventories...................................................................................................................... (1,686) (1,055) (900)
Prepaid expenses............................................................................................................ (4,078) (358) 538
Accounts payable ........................................................................................................... (1,418) (2,232) 2,085
Accrued expenses........................................................................................................... 26,511 10,628 5,618
Deferred revenue............................................................................................................ (76) (208) (497)
Deferred rent .................................................................................................................. 3,754 7,680 3,751
Other long-term liabilities .............................................................................................. 2,468 — —
Other .............................................................................................................................. — — 172
Net cash provided by operating activities .................................................................... 110,628 84,284 73,102
Cash flows from investing activities:
Additions to property and equipment................................................................................ (82,056) (80,429) (45,761)
Acquisitions, net of cash acquired .................................................................................... (28,261) (5,224) (20,969)
Purchase of investments.................................................................................................... (20,025) (28,792) (4,000)
Investment maturities proceeds......................................................................................... 2,000 9,300 4,000
(Increase) decrease in deposits and other......................................................................... (1,298) 2,854 (126)
Net cash used in investing activities ............................................................................ (129,640) (102,291) (66,856)
Cash flows from financing activities:
Exercise of employee stock options.................................................................................. 12,632 3,569 4,211
Proceeds from issuance of common stock ........................................................................ 1,192 1,073 814
Other ................................................................................................................................. — 602 1,207
Net cash provided by financing activities .................................................................... 13,824 5,244 6,232
Net (decrease) increase in cash and cash equivalents......................................................... (5,188) (12,763) 12,478
Cash and cash equivalents at beginning of period.............................................................. 29,639 42,402 29,924
Cash and cash equivalents at end of period ........................................................................ $ 24,451 $ 29,639 $ 42,402
Supplemental cash flow information:
Cash paid during the year for:
Interest ......................................................................................................................... $ — $ — $ 22
Income taxes ................................................................................................................ $ 23,161 $ 10,367 $ 783
Noncash investing activities:
Accrued property and equipment purchases ................................................................ $ 15,208 $ 9,066 $ 7,196
Assets transferred to minority interest owner............................................................... $ — $ 2,673 $ —
The accompanying notes are an integral part of the consolidated financial statements.