Panera Bread 2005 Annual Report Download - page 22
Download and view the complete annual report
Please find page 22 of the 2005 Panera Bread annual report below. You can navigate through the pages in the report by either clicking on the pages listed below, or by using the keyword search tool below to find specific information within the annual report.-
 1
1 -
2
-
3
-
4
-
5
-
6
-
7
-
8
-
9
-
10
-
11
-
 12
12 -
 13
13 -
 14
14 -
 15
15 -
 16
16 -
 17
17 -
 18
18 -
 19
19 -
 20
20 -
 21
21 -
 22
22 -
 23
23 -
 24
24 -
 25
25 -
 26
26 -
 27
27 -
 28
28 -
 29
29 -
 30
30 -
 31
31 -
 32
32 -
33
-
34
-
35
-
36
-
37
-
38
-
39
-
40
-
41
-
42
-
43
-
44
-
45
-
46
-
47
-
48
-
49
-
50
-
51
-
52
-
53
-
54
-
55
-
56
-
57
-
58
-
59
-
60
-
61
-
62
-
63
-
64
-
65
-
66
-
67
-
68
-
69
-
70
-
71
-
72
 |
 |

16
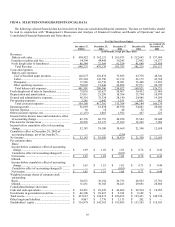
ITEM 6. SELECTED CONSOLIDATED FINANCIAL DATA
The following selected financial data has been derived from our consolidated financial statements. The data set forth below should
be read in conjunction with “Management’s Discussion and Analysis of Financial Condition and Results of Operations” and our
Consolidated Financial Statements and Notes thereto.
For The Fiscal Years Ended
December 27,
2005(1)
December 25,
2004
December 27,
2003
December 28,
2002
(as restated) (2)
December 29,
2001
(in thousands, except per share data)
Revenues:
Bakery-cafe sales .................................................... $ 499,422 $ 362,121 $ 265,933 $ 212,645 $ 157,684
Franchise royalties and fees .................................... 54,309 44,449 36,245 27,892 19,577
Fresh dough sales to franchisees............................. 86,544 72,569 61,524 41,688 23,856
Total Revenue .................................................... 640,275 479,139 363,702 282,225 201,117
Costs and expenses:
Bakery-cafe expenses:
Cost of food and paper products.......................... 142,675 101,832 73,885 63,370 48,341
Labor.................................................................... 151,524 110,790 81,152 63,172 45,768
Occupancy............................................................ 37,389 26,730 18,981 15,408 11,893
Other operating expenses..................................... 70,003 51,044 36,804 27,971 20,729
Total bakery-cafe expenses ................................ 401,591 290,396 210,822 169,921 126,731
Fresh dough cost of sales to franchisees................... 75,036 65,627 54,967 38,432 21,965
Depreciation and amortization.................................. 33,011 25,298 18,304 13,794 10,979
General and administrative expenses........................ 46,301 33,338 28,140 24,986 19,589
Pre-opening expenses ............................................... 3,241 2,642 1,531 1,051 912
Total costs and expenses .................................... 559,180 417,301 313,764 248,184 180,176
Operating profit ........................................................ 81,095 61,838 49,938 34,041 20,941
Interest expense ........................................................ 50 18 48 32 72
Other (income) expense, net ..................................... (1,133) 1,065 1,592 467 221
Income before income taxes and cumulative effect
of accounting change .............................................. 82,178 60,755 48,298 33,542 20,648
Provision for income taxes ....................................... 29,995 22,175 17,629 12,242 7,989
Income before cumulative effect of accounting
change..................................................................... 52,183 38,580 30,669 21,300 12,659
Cumulative effect to December 28, 2002 of
accounting change, net of tax benefit(3)................. — — (239) — —
Net income................................................................ $ 52,183 $ 38,580 $ 30,430 $ 21,300 $ 12,659
Per common share:
Basic:
Income before cumulative effect of accounting
change ................................................................... $ 1.69 $ 1.28 $ 1.03 $ 0.74 $ 0.46
Cumulative effect of accounting changes(3) .......... — — (0.01) — —
Net income .............................................................. $ 1.69 $ 1.28 $ 1.02 $ 0.74 $ 0.46
Diluted:
Income before cumulative effect of accounting
change ................................................................... $ 1.65 $ 1.25 $ 1.01 $ 0.71 $ 0.44
Cumulative effect of accounting changes(3) .......... — — (0.01) — —
Net income .............................................................. $ 1.65 $ 1.25 $ 1.00 $ 0.71 $ 0.44
Weighted average shares of common stock
outstanding:
Basic........................................................................ 30,871 30,154 29,733 28,923 27,783
Diluted..................................................................... 31,651 30,768 30,423 29,891 28,886
Consolidated balance sheet data:
Cash and cash equivalents ........................................ $ 24,451 $ 29,639 $ 42,402 $ 29,924 $ 18,052
Investments in government securities....................... $ 46,308 $ 28,415 $ 9,019 $ 9,149 $ —
Total assets................................................................ $ 437,667 $ 324,672 $ 256,835 $ 195,431 $ 148,720
Other long-term liabilities......................................... $ 4,867 $ 1,776 $ 1,115 $ 262 $ —
Stockholders’ equity ................................................. $ 316,978 $ 241,363 $ 193,805 $ 151,503 $ 118,185