Panera Bread 2005 Annual Report Download - page 30
Download and view the complete annual report
Please find page 30 of the 2005 Panera Bread annual report below. You can navigate through the pages in the report by either clicking on the pages listed below, or by using the keyword search tool below to find specific information within the annual report.-
 1
1 -
2
-
3
-
4
-
5
-
6
-
7
-
8
-
9
-
10
-
11
-
12
-
13
-
14
-
15
-
16
-
17
-
18
-
19
-
 20
20 -
 21
21 -
 22
22 -
 23
23 -
 24
24 -
 25
25 -
 26
26 -
 27
27 -
 28
28 -
 29
29 -
 30
30 -
 31
31 -
 32
32 -
 33
33 -
 34
34 -
 35
35 -
 36
36 -
 37
37 -
 38
38 -
 39
39 -
 40
40 -
41
-
42
-
43
-
44
-
45
-
46
-
47
-
48
-
49
-
50
-
51
-
52
-
53
-
54
-
55
-
56
-
57
-
58
-
59
-
60
-
61
-
62
-
63
-
64
-
65
-
66
-
67
-
68
-
69
-
70
-
71
-
72
 |
 |
24
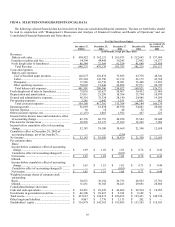
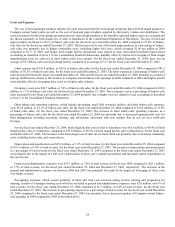
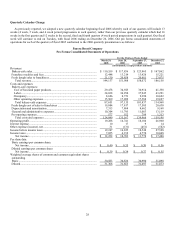
Costs and Expenses
The cost of food and paper products includes the costs associated with the fresh dough operations that sell fresh dough products to
Company-owned bakery-cafes as well as the cost of food and paper products supplied by third party vendors and distributors. The
costs associated with the fresh dough operations that sell fresh dough products to the franchise-operated bakery-cafes are excluded and
are shown separately as fresh dough cost of sales to franchisees in the Consolidated Statements of Operations. The cost of food and
paper products increased to 28.1% of bakery-cafe sales for the fiscal year ended December 25, 2004 compared to 27.8% of bakery-
cafe sales for the fiscal year ended December 27, 2003. This increase in the cost of food and paper products as a percentage of bakery-
cafe sales was primarily due to higher commodity costs, including higher fuel costs, which averaged $2.06 per gallon in 2004
compared to $1.71 in 2003, and higher fresh dough facility operational costs related to lease and related leasehold improvement
accounting as described in Note 2 to the Consolidated Financial Statements, partially offset by improved leveraging of fresh dough
manufacturing costs we achieved as more bakery-cafes were opened. For the fiscal year ended December 25, 2004, there was an
average of 39.2 bakery-cafes per fresh dough facility compared to an average of 32.7 for the fiscal year ended December 27, 2003.
Labor expense was $110.8 million, or 30.6% of bakery-cafe sales, for the fiscal year ended December 25, 2004 compared to $81.2
million, or 30.5% of bakery-cafe sales, for the fiscal year ended December 27, 2003. The labor expense as a percentage of bakery-cafe
sales increased between the fiscal year ended December 25, 2004 and the fiscal year ended December 27, 2003 primarily as a result of
start-up inefficiencies related to the increase in Company-owned bakery-cafe openings in 2004 compared to 2003 and higher benefit
costs partially offset by leveraging these costs over higher sales volumes.
Occupancy costs were $26.7 million, or 7.4% of bakery-cafe sales, for the fiscal year ended December 25, 2004 compared to $19.0
million, or 7.1% of bakery-cafe sales, for the fiscal year ended December 27, 2003. The occupancy cost as a percentage of bakery-cafe
sales increased for the fiscal year ended December 25, 2004 primarily due to higher rent cost related to lease accounting as described
in Note 2 to the Consolidated Financial Statements.
Other bakery-cafe operating expenses, which include advertising, retail field overhead, utilities, and other bakery-cafe expenses,
were $51.0 million, or 14.1% of bakery-cafe sales, for the fiscal year ended December 25, 2004 compared to $36.8 million, or 13.8%
of bakery-cafe sales, for the fiscal year ended December 27, 2003. The increase in other bakery-cafe operating expenses as a
percentage of bakery-cafe sales for the fiscal year ended December 25, 2004 was primarily due to increased organizational costs for
field management, including recruiting, training, and advertising, associated with new markets that do not yet have multi-unit
leverage.
For the fiscal year ended December 25, 2004, fresh dough facility cost of sales to franchisees was $65.6 million, or 90.4% of fresh
dough facility sales to franchisees, compared to $55.0 million, or 89.3% of fresh dough facility sales to franchisees, for the fiscal year
ended December 27, 2003. The increase in the fresh dough cost of sales rate in fiscal 2004 was primarily due to increased commodity
costs, including butter, tuna, and cream cheese.
Depreciation and amortization was $25.3 million, or 5.3% of total revenue, for the fiscal year ended December 25, 2004 compared
to $18.3 million, or 5.0% of total revenue, for the fiscal year ended December 27, 2003. The increase in depreciation and amortization
as a percentage of total revenue for the fiscal year ended December 25, 2004 compared to the fiscal year ended December 27, 2003
was primarily due to the impact of a full year’s depreciation of prior year’s capital expenditures and increased capital expenditures in
the current year.
General and administrative expenses were $33.3 million, or 7.0% of total revenue for fiscal year 2004, compared to $28.1 million,
or 7.7% of total revenue, for the fiscal year ended December 25, 2004 and December 27, 2003, respectively. The decrease in the
general and administrative expense rate between 2004 and 2003 was primarily the result of the improved leveraging of these costs
over higher revenue.
Pre-opening expenses, which consist primarily of labor and food costs incurred during in-store training and preparation for
opening, exclusive of manager training costs which are included in general and administrative expenses, were $2.6 million, or 0.6% of
total revenue, for the fiscal year ended December 25, 2004 compared to $1.5 million, or 0.4% of total revenue, for the fiscal year
ended December 27, 2003. The increase in pre-opening expenses as a percentage of total revenue for the fiscal year ended December
25, 2004 compared to the fiscal year ended December 27, 2003 was primarily due to increased number of Company-owned bakery-
cafe openings in 2004 compared to 2003 as described above.