Panera Bread 2005 Annual Report Download - page 18
Download and view the complete annual report
Please find page 18 of the 2005 Panera Bread annual report below. You can navigate through the pages in the report by either clicking on the pages listed below, or by using the keyword search tool below to find specific information within the annual report.-
 1
1 -
2
-
3
-
4
-
5
-
6
-
7
-
 8
8 -
 9
9 -
 10
10 -
 11
11 -
 12
12 -
 13
13 -
 14
14 -
 15
15 -
 16
16 -
 17
17 -
 18
18 -
 19
19 -
 20
20 -
 21
21 -
 22
22 -
 23
23 -
 24
24 -
 25
25 -
 26
26 -
 27
27 -
 28
28 -
29
-
30
-
31
-
32
-
33
-
34
-
35
-
36
-
37
-
38
-
39
-
40
-
41
-
42
-
43
-
44
-
45
-
46
-
47
-
48
-
49
-
50
-
51
-
52
-
53
-
54
-
55
-
56
-
57
-
58
-
59
-
60
-
61
-
62
-
63
-
64
-
65
-
66
-
67
-
68
-
69
-
70
-
71
-
72
 |
 |
12
• changes in demographics, consumer preferences and discretionary spending;
• changes in business strategy including concept evolution and new designs;
• fluctuations in supply costs, shortages or interruptions;
• negative publicity about the ingredients we use or the occurrence of food-borne illnesses or other problems at our bakery-cafes;
• natural disasters and other calamities; and
• general economic conditions, both nationally and locally.
Additionally, our sales have fluctuated by season due to the number and timing of bakery-cafe openings and related expense,
consumer spending patterns and weather. Historically, sales have been higher during the winter holiday season as a result of increased
traffic, higher baked goods sales and family and community gatherings. In fiscal year 2005, Company-owned bakery-cafes had an
aggregate of approximately $109 million in sales in the second quarter which was our recorded lowest relative quarterly sales in that
year and included 13 Company-owned bakery-cafe openings. Comparatively, in our fourth quarter we had an aggregate of
approximately $137 million in sales with 26 Company-owned bakery-cafe openings in that quarter recording the highest relative
quarterly sales for fiscal year 2005.
Accordingly, results for any one quarter are not necessarily indicative of results to be expected for any other quarter.
ITEM 1B. UNRESOLVED STAFF COMMENTS
None.
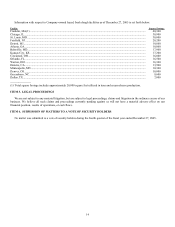
ITEM 2. PROPERTIES
The average Company-owned bakery-cafe size is approximately 4,600 square feet. We lease substantially all of our bakery-cafe
locations and all of our fresh dough facilities. Lease terms are typically for ten years with one, two, or three five-year renewal option
periods thereafter. Leases typically have charges for minimum base occupancy, a proportionate share of building and common area
operating expenses and real estate taxes, and a contingent percentage rent based on sales above a stipulated sales level. Certain of our
lease agreements provide for scheduled rent increases during the lease terms or for rental payments commencing at a date other than
the date of initial occupancy. See Note 2 to the Consolidated Financial Statements for further information on our accounting for leases.