Panera Bread 2005 Annual Report Download - page 28
Download and view the complete annual report
Please find page 28 of the 2005 Panera Bread annual report below. You can navigate through the pages in the report by either clicking on the pages listed below, or by using the keyword search tool below to find specific information within the annual report.-
 1
1 -
2
-
3
-
4
-
5
-
6
-
7
-
8
-
9
-
10
-
11
-
12
-
13
-
14
-
15
-
16
-
17
-
 18
18 -
 19
19 -
 20
20 -
 21
21 -
 22
22 -
 23
23 -
 24
24 -
 25
25 -
 26
26 -
 27
27 -
 28
28 -
 29
29 -
 30
30 -
 31
31 -
 32
32 -
 33
33 -
 34
34 -
 35
35 -
 36
36 -
 37
37 -
 38
38 -
39
-
40
-
41
-
42
-
43
-
44
-
45
-
46
-
47
-
48
-
49
-
50
-
51
-
52
-
53
-
54
-
55
-
56
-
57
-
58
-
59
-
60
-
61
-
62
-
63
-
64
-
65
-
66
-
67
-
68
-
69
-
70
-
71
-
72
 |
 |

22
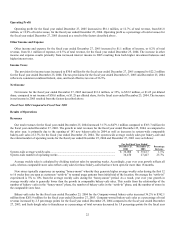
Operating Profit
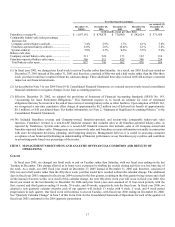
Operating profit for the fiscal year ended December 27, 2005 increased to $81.1 million, or 12.7% of total revenue, from $61.8
million, or 12.9% of total revenue, for the fiscal year ended December 25, 2004. Operating profit as a percentage of total revenues for
the fiscal year ended December 27, 2005 deceased as a result of the factors described above.
Other Income and Expense
Other income and expense for the fiscal year ended December 27, 2005 increased to $1.1 million of income, or 0.2% of total
revenue, from $1.1 million of expense, or 0.3% of total revenue, for the fiscal year ended December 25, 2004. The increase in other
income and expense results primarily from increased interest income in 2005 resulting from both higher investment balances and
higher interest rates.
Income Taxes
The provision for income taxes increased to $30.0 million for the fiscal year ended December 27, 2005 compared to $22.2 million
for the fiscal year ended December 25, 2004. The tax provisions for the fiscal year ended December 27, 2005 and December 25, 2004
reflected a consistent combined federal, state, and local effective tax rate of 36.5%.
Net Income
Net income for the fiscal year ended December 27, 2005 increased $13.6 million, or 35%, to $52.2 million, or $1.65 per diluted
share, compared to net income of $38.6 million, or $1.25 per diluted share, for the fiscal year ended December 25, 2004. The increase
in net income in 2005 resulted from the factors described above.
Fiscal Year 2004 Compared to Fiscal Year 2003
Results of Operations
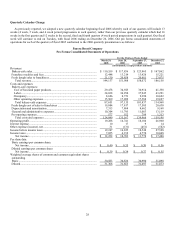
Revenues
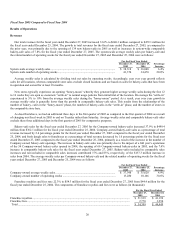
Our total revenues for the fiscal year ended December 25, 2004 increased 31.7% to $479.1 million compared to $363.7 million for
the fiscal year ended December 27, 2003. The growth in total revenues for the fiscal year ended December 25, 2004, as compared to
the prior year, is primarily due to the opening of 143 new bakery-cafes in 2004 as well as increases in system-wide comparable
bakery-cafe sales of 2.7% for the fiscal year ended December 25, 2004. The system-wide average weekly sales per bakery-cafe and
the related number of operating weeks for the fiscal year ended December 25, 2004 and December 27, 2003 were as follows:
For the Fiscal Year Ended
December 25,
2004
December 27,
2003
Percentage
Increase
System-wide average weekly sales.......................................................................................... $ 36,008 $ 35,617 1.1%
System-wide number of operating weeks ................................................................................ 34,470 27,427 25.7%
Average weekly sales is calculated by dividing total net sales by operating weeks. Accordingly, year over year growth reflects all
sales, whereas comparable store sales reflects only sales for those bakery-cafes that have been open for more than 18 months.
New stores typically experience an opening “honey-moon” whereby they generate higher average weekly sales during the first 12
to 16 weeks they are open as customers “settle-in” to normal usage patterns from initial trial of the location. On average the “settle-in”
experienced is 5% to 10% from the average weekly sales during the “honey-moon” period. As a result, year over year growth in
average weekly sales is generally lower than the growth in comparable bakery-cafe sales. This results from the relationship of the
number of bakery- cafes in the “honey-moon” phase, the number of bakery-cafes in the “settle-in” phase, and the number of stores in
the comparable store base.
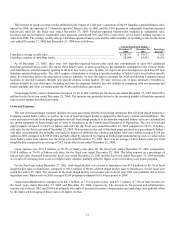
Bakery-cafe sales for the fiscal year ended December 25, 2004 for the Company-owned bakery-cafes increased 36.2% to $362.1
million from $265.9 million for the fiscal year ended December 27, 2003. Company-owned bakery-cafe sales as a percentage of total
revenue increased by 2.5 percentage points for the fiscal year ended December 25, 2004 compared to the fiscal year ended December
27, 2003, and fresh dough sales to franchisees as a percentage of total revenue decreased by 1.8 percentage points for the fiscal year