Panera Bread 2005 Annual Report Download - page 24
Download and view the complete annual report
Please find page 24 of the 2005 Panera Bread annual report below. You can navigate through the pages in the report by either clicking on the pages listed below, or by using the keyword search tool below to find specific information within the annual report.-
 1
1 -
2
-
3
-
4
-
5
-
6
-
7
-
8
-
9
-
10
-
11
-
12
-
13
-
 14
14 -
 15
15 -
 16
16 -
 17
17 -
 18
18 -
 19
19 -
 20
20 -
 21
21 -
 22
22 -
 23
23 -
 24
24 -
 25
25 -
 26
26 -
 27
27 -
 28
28 -
 29
29 -
 30
30 -
 31
31 -
 32
32 -
 33
33 -
 34
34 -
35
-
36
-
37
-
38
-
39
-
40
-
41
-
42
-
43
-
44
-
45
-
46
-
47
-
48
-
49
-
50
-
51
-
52
-
53
-
54
-
55
-
56
-
57
-
58
-
59
-
60
-
61
-
62
-
63
-
64
-
65
-
66
-
67
-
68
-
69
-
70
-
71
-
72
 |
 |

18
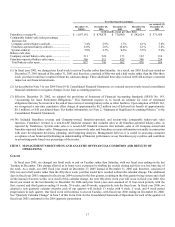
We include in this report information on Company, franchisee, and/or system-wide comparable bakery-cafe sales increases and
average weekly sales. System-wide sales are a non-GAAP financial measure that includes sales at all Company-owned and franchise-
operated bakery-cafes, as reported by franchisees. Management uses system-wide sales information internally in connection with store
development decisions, planning, and budgeting analyses. Management believes it is useful in assessing consumer acceptance of our
brand and facilitating an understanding of financial performance as our franchisees pay royalties and contribute to advertising pools
based on a percentage of their sales.
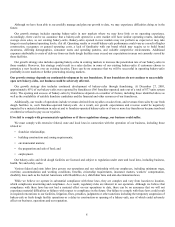
Our revenues are derived from Company-owned bakery-cafe sales, fresh dough sales to franchisees, and franchise royalties and
fees. Fresh dough sales to franchisees are primarily the sales of dough products to our franchisees and the sales of tuna and cream
cheese to certain franchisees. Franchise royalties and fees include royalty income and franchise fees. The cost of food and paper
products, labor, occupancy, and other operating expenses relate primarily to Company-owned bakery-cafe sales. The cost of fresh
dough sales relates primarily to the sale of fresh dough products and tuna and cream cheese to franchisees. General and administrative,
depreciation, and pre-opening expenses relate to all areas of revenue generation.
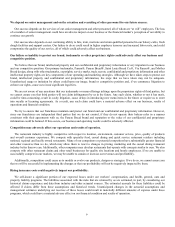
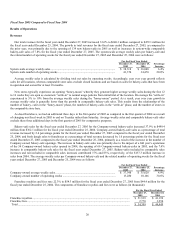
In fiscal year 2005, we earned $1.65 per diluted share with the following system-wide performance on key metrics: 139 new
bakery-cafes opened in fiscal 2005, including 66 new Company-owned bakery-cafes and 73 new franchise-operated bakery-cafes,
comparable bakery-cafe sales growth of 7.8%, average weekly sales of $38,318, and operating weeks of 41,370.
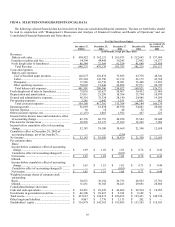
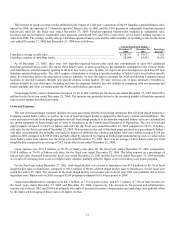
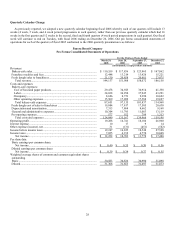
The following table sets forth the percentage relationship to total revenues, except where otherwise indicated, of certain items
included in our consolidated statements of operations for the periods indicated. Percentages may not add due to rounding:
For the Fiscal Years Ended
December 27,
2005
December 25,
2004
December 27,
2003
Revenues:
Bakery-cafe sales ............................................................................................................... 78.0% 75.6% 73.1%
Franchise royalties and fees ............................................................................................... 8.5 9.3 10.0
Fresh dough sales to franchisees........................................................................................ 13.5 15.1 16.9
Total revenue................................................................................................................. 100.0% 100.0% 100.0%
Costs and expenses:
Bakery-cafe expenses(1):
Cost of food and paper products..................................................................................... 28.6% 28.1% 27.8%
Labor............................................................................................................................... 30.3 30.6 30.5
Occupancy....................................................................................................................... 7.5 7.4 7.1
Other operating expenses................................................................................................ 14.0 14.1 13.8
Total bakery-cafe expenses ........................................................................................... 80.4 80.2 79.2
Fresh dough cost of sales to franchisees(2) ....................................................................... 86.7 90.4 89.3
Depreciation and amortization ........................................................................................... 5.2 5.3 5.0
General and administrative expenses................................................................................. 7.2 7.0 7.7
Pre-opening expenses......................................................................................................... 0.5 0.6 0.4
Total costs and expenses ............................................................................................... 87.3 87.1 86.3
Operating profit ................................................................................................................... 12.7 12.9 13.7
Interest expense ................................................................................................................... — — —
Other (income) expense, net ................................................................................................ (0.2) 0.3 0.4
Income before income taxes and cumulative effect of accounting change.......................... 12.8 12.7 13.3
Income taxes ........................................................................................................................ 4.7 4.6 4.8
Income before cumulative effect of accounting change ...................................................... 8.2 8.1 8.4
Cumulative effect to December 28, 2002 of accounting change, net of tax ........................ — — (0.1)
Net income.................................................................................................................... 8.2% 8.1% 8.4%
____________
(1) As a percentage of bakery-cafe sales.
(2) As a percentage of fresh dough facility sales to franchisees.