Nordstrom 2002 Annual Report Download - page 46
Download and view the complete annual report
Please find page 46 of the 2002 Nordstrom annual report below. You can navigate through the pages in the report by either clicking on the pages listed below, or by using the keyword search tool below to find specific information within the annual report.-
 1
1 -
2
-
3
-
4
-
5
-
6
-
7
-
8
-
9
-
10
-
11
-
12
-
13
-
14
-
15
-
16
-
17
-
18
-
19
-
20
-
21
-
22
-
23
-
24
-
25
-
26
-
27
-
28
-
29
-
30
-
31
-
32
-
33
-
34
-
35
-
 36
36 -
 37
37 -
 38
38 -
 39
39 -
 40
40 -
 41
41 -
 42
42 -
 43
43 -
 44
44 -
 45
45 -
 46
46 -
 47
47 -
 48
48 -
 49
49 -
 50
50 -
 51
51 -
 52
52
 |
 |

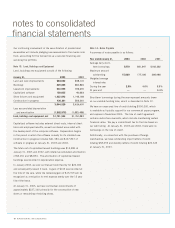
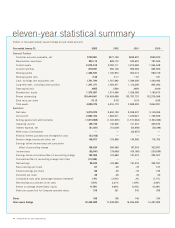
eleven-year statistical summary
44 NORDSTROM INC. AND SUBSIDIARIES
Dollars in thousands except square footage and per share amounts
Year ended January 31, 2003 2002 2001 2000
Financial Position
Customer accounts receivable, net $730,081 $677,150 $699,687 $596,020
Merchandise inventories 953,112 888,172 945,687 797,845
Current assets 2,072,618 2,057,111 1,812,982 1,564,648
Current liabilities 870,091 950,138 950,568 866,509
Working capital 1,202,527 1,106,973 862,414 698,139
Working capital ratio 2.38 2.17 1.91 1.81
Land, buildings and equipment, net 1,761,544 1,761,082 1,599,938 1,429,492
Long-term debt, including current portion 1,347,371 1,429,271 1,112,296 804,982
Debt/capital ratio .4955 .5209 .4929 .4249
Shareholders’ equity 1,372,057 1,314,488 1,229,568 1,185,614
Shares outstanding 135,444,041 134,468,608 133,797,757 132,279,988
Book value per share 10.13 9.78 9.19 8.96
Total assets 4,096,376 4,051,179 3,608,503 3,062,081
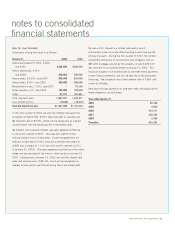
Operations
Net sales 5,975,076 5,634,130 5,528,537 5,149,266
Gross profit 2,003,704 1,868,271 1,879,021 1,789,506
Selling, general and administrative (1,813,968) (1,722,635) (1,747,048) (1,523,836)
Operating income 189,736 145,636 131,973 265,670
Interest expense, net (81,921) (75,038) (62,698) (50,396)
Write-down of investment —— (32,857) —
Minority interest purchase and reintegration costs (53,168) —— —
Service charge income and other, net 140,977 133,890 130,600 116,783
Earnings before income taxes and cumulative
effect of accounting change 195,624 204,488 167,018 332,057
Income taxes (92,041) (79,800) (65,100) (129,500)
Earnings before cumulative effect of accounting change 103,583 124,688 101,918 202,557
Cumulative effect of accounting change (net of tax) (13,359) —— —
Net earnings 90,224 124,688 101,918 202,557
Basic earnings per share .67 .93 .78 1.47
Diluted earnings per share .66 .93 .78 1.46
Dividends per share .38 .36 .35 .32
Comparable store sales percentage increase (decrease) 1.4% (2.9%) .3% (1.1%)
Net earnings as a percent of net sales 1.51% 2.21% 1.84% 3.93%
Return on average shareholders’ equity 6.72% 9.80% 8.44% 16.29%
Sales per square foot for Company-operated stores 319 321 342 350
Stores 166 156 140 104
Total square footage 18,428,000 17,048,000 16,056,000 14,487,000