Nordstrom 2002 Annual Report Download - page 28
Download and view the complete annual report
Please find page 28 of the 2002 Nordstrom annual report below. You can navigate through the pages in the report by either clicking on the pages listed below, or by using the keyword search tool below to find specific information within the annual report.-
 1
1 -
2
-
3
-
4
-
5
-
6
-
7
-
8
-
9
-
10
-
11
-
12
-
13
-
14
-
15
-
16
-
17
-
 18
18 -
 19
19 -
 20
20 -
 21
21 -
 22
22 -
 23
23 -
 24
24 -
 25
25 -
 26
26 -
 27
27 -
 28
28 -
 29
29 -
 30
30 -
 31
31 -
 32
32 -
 33
33 -
 34
34 -
 35
35 -
 36
36 -
 37
37 -
 38
38 -
39
-
40
-
41
-
42
-
43
-
44
-
45
-
46
-
47
-
48
-
49
-
50
-
51
-
52
 |
 |

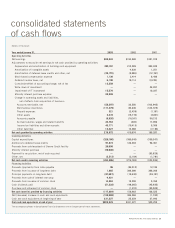
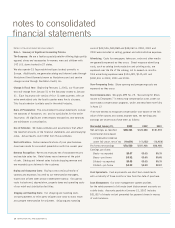
notes to consolidated
financial statements
26 NORDSTROM INC. AND SUBSIDIARIES
Dollars in thousands except per share amounts
Note 1: Summary of Significant Accounting Policies
The Company: We are a fashion specialty retailer offering high-quality
apparel, shoes and accessories for women, men and children with
142 U.S. stores located in 27 states.
We also operate 23 Façonnable boutiques located primarily in
Europe. Additionally, we generate catalog and Internet sales through
Nordstrom Direct (formerly known as Nordstrom.com) and service
charge income through Nordstrom Credit, Inc.
Change in Fiscal Year: Beginning February 1, 2003, our fiscal year
end will change from January 31 to the Saturday closest to January
31. Each fiscal year will consist of four 13 week quarters, with an
extra week added onto the fourth quarter every five to six years.
This fiscal calendar is widely used in the retail industry.
Basis of Presentation: The consolidated financial statements include
the balances of Nordstrom, Inc. and its subsidiaries for the entire
fiscal year. All significant intercompany transactions and balances
are eliminated in consolidation.
Use of Estimates: We make estimates and assumptions that affect
the reported amounts in the financial statements and accompanying
notes. Actual results could differ from those estimates.
Reclassifications: Certain reclassifications of prior year balances
have been made for consistent presentation with the current year.
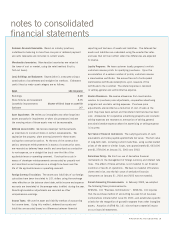
Revenue Recognition: We record revenues net of estimated returns
and exclude sales tax. Retail stores record revenue at the point
of sale. Catalog and Internet sales include shipping revenue and
are recorded upon delivery to the customer.
Buying and Occupancy Costs: Buying costs consist primarily of
salaries and expenses incurred by our merchandise managers,
buyers and private label product development group. Occupancy
costs include rent, depreciation, property taxes and operating costs
of our retail and distribution facilities.
Shipping and Handling Costs: Our shipping and handling costs
include payments to third-party shippers and costs to store, move
and prepare merchandise for shipment. Shipping and handling
costs of $42,506, $30,868 and $38,062 in 2002, 2001 and
2000 were included in selling, general and administrative expenses.
Advertising: Costs for newspaper, television, radio and other media
are generally expensed as they occur. Direct response advertising
costs, such as catalog book production and printing costs, are
expensed over the life of the catalog, not to exceed six months.
Total advertising expenses were $144,482, $145,341 and
$190,991 in 2002, 2001 and 2000.
Store Preopening Costs: Store opening and preopening costs are
expensed as they occur.
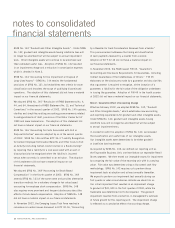
Stock Compensation: We apply APB No. 25, “Accounting for Stock
Issued to Employees,” in measuring compensation costs under our
stock-based compensation programs, which are described more fully
in Note 17.
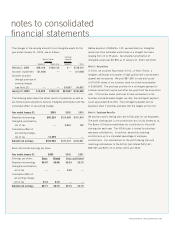
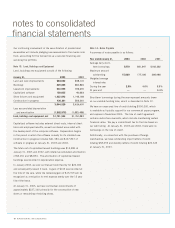
If we had elected to recognize compensation cost based on the fair
value of the options and shares at grant date, net earnings and
earnings per share would have been as follows:
Year ended January 31, 2003 2002 2001
Net earnings, as reported $90,224 $124,688 $101,918
Incremental stock-based
compensation expense
under fair value, net of tax (19,674) (17,252) (13,458)
Pro forma net earnings $70,550 $107,436 $88,460
Earnings per share:
Basic—as reported $0.67 $0.93 $0.78
Basic—pro forma $0.52 $0.80 $0.68
Diluted—as reported $0.66 $0.93 $0.78
Diluted—pro forma $0.52 $0.80 $0.67
Cash Equivalents: Cash equivalents are short-term investments
with a maturity of three months or less from the date of purchase.
Cash Management: Our cash management system provides
for the reimbursement of all major bank disbursement accounts on
a daily basis. Accounts payable at January 31, 2002 includes
$31,817 of checks not yet presented for payment drawn in excess
of cash balances.