Nordstrom 2002 Annual Report Download - page 18
Download and view the complete annual report
Please find page 18 of the 2002 Nordstrom annual report below. You can navigate through the pages in the report by either clicking on the pages listed below, or by using the keyword search tool below to find specific information within the annual report.
management’s discussion
and analysis
16 NORDSTROM INC. AND SUBSIDIARIES
Capital Expenditures
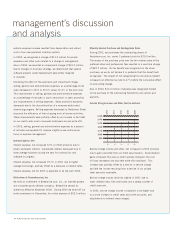
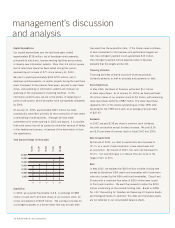
Our capital expenditures over the last three years totaled
approximately $738 million, net of developer reimbursements,
principally to add stores, improve existing facilities and purchase
or develop new information systems. More than 3.9 million square
feet of retail store space has been added during this period,
representing an increase of 27% since January 31, 2000.
We plan to spend approximately $700-$750 million, net of
developer reimbursements, on capital projects during the next three
years. Compared to the previous three years, we plan to open fewer
stores, slow spending on information systems and increase our
spending on the improvement of existing facilities. In the
information systems area, we are in the process of replacing our
point of sale system, which we expect to be substantially completed
by 2004.
At January 31, 2003, approximately $227 million has been
contractually committed primarily for the construction of new stores
or remodeling of existing stores. Although we have made
commitments for stores opening in 2003 and beyond, it is possible
that some stores may not be opened as scheduled because of delays
in the development process, or because of the termination of store
site negotiations.
Total Square Footage (in thousands)
Acquisition
In 2000, we acquired Façonnable, S.A.S. in exchange for $88
million of cash and 5,074,000 shares of our common stock, for
a total consideration of $169 million. The purchase provides for
a contingent payment to a former owner that may be paid after
five years from the acquisition date. If the former owner continues
to have involvement in the business and performance targets are
met, the contingent payment could approximate $12 million.
The contingent payment will be expensed when it becomes
probable that the targets will be met.
Financing Activities
Financing activities primarily consist of share repurchases,
dividend payments, as well as proceeds and payments on debt.
Share Repurchase
In May 1995, the Board of Directors authorized $1.1 billion
of share repurchases. As of January 31, 2003, we have purchased
39 million shares of our common stock for $1 billion, with remaining
share repurchase authority of $82 million. The share repurchase
represents 24% of the shares outstanding as of May 1995 after
adjusting for the 1998 stock split, at an average price per share
of $25.93.
Dividends
In 2002, we paid $.38 per share in common stock dividends,
the sixth consecutive annual dividend increase. We paid $.36
and $.35 per share of common stock in fiscal 2001 and 2000.
Debt to Capital Ratio
By the end of 2001, our debt to capital ratio had increased to
52.1% as a result of retail expansion, share repurchases and
an acquisition. By the end of 2002, this ratio had decreased to
49.6%. Our near-term goal is to reduce this ratio to be in the
range of 40% to 45%.
Debt
In May 2002, we replaced the $200 million variable funding note
backed by Nordstrom VISA credit card receivables with 5-year term
notes also backed by the VISA credit card receivables. Class A and
B notes with a combined face value of $200 million were issued
to third party investors. We used the proceeds to retire the $200
million outstanding on the variable funding note. Based on SFAS
No. 140 “Accounting for Transfers and Servicing of Financial Assets
and Extinguishments of Liabilities” this debt and the related assets
are not reflected in our consolidated balance sheets.
98 99 00 01 02
20,000
18,000
16,000
14,000
12,000
10,000
8,000
13,593
14,487
16,056
17,048
18,428
•
•
•
•
•


