Nordstrom 2002 Annual Report Download - page 27
Download and view the complete annual report
Please find page 27 of the 2002 Nordstrom annual report below. You can navigate through the pages in the report by either clicking on the pages listed below, or by using the keyword search tool below to find specific information within the annual report.-
 1
1 -
2
-
3
-
4
-
5
-
6
-
7
-
8
-
9
-
10
-
11
-
12
-
13
-
14
-
15
-
16
-
 17
17 -
 18
18 -
 19
19 -
 20
20 -
 21
21 -
 22
22 -
 23
23 -
 24
24 -
 25
25 -
 26
26 -
 27
27 -
 28
28 -
 29
29 -
 30
30 -
 31
31 -
 32
32 -
 33
33 -
 34
34 -
 35
35 -
 36
36 -
 37
37 -
38
-
39
-
40
-
41
-
42
-
43
-
44
-
45
-
46
-
47
-
48
-
49
-
50
-
51
-
52
 |
 |

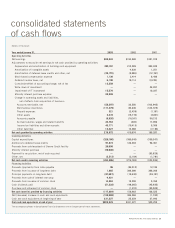
consolidated statements
of cash flows
NORDSTROM INC. AND SUBSIDIARIES 25
Dollars in thousands
Year ended January 31, 2003 2002 2001
Operating Activities
Net earnings $90,224 $124,688 $101,918
Adjustments to reconcile net earnings to net cash provided by operating activities:
Depreciation and amortization of buildings and equipment 233,931 213,089 203,048
Amortization of intangible assets — 4,630 1,251
Amortization of deferred lease credits and other, net (22,179) (8,886) (12,761)
Stock-based compensation expense 1,130 3,414 6,480
Deferred income taxes, net 6,190 16,114 (3,234)
Cumulative effect of accounting change, net of tax 13,359 ——
Write-down of investment —— 32,857
Impairment of IT investment 15,570 — 10,227
Minority interest purchase expense 40,389 ——
Change in operating assets and liabilities,
net of effects from acquisition of business:
Accounts receivable, net (58,397) 22,556 (102,945)
Merchandise inventories (117,379) 80,246 (120,729)
Prepaid expenses 521 (2,438) (1,191)
Other assets 3,378 (16,770) (3,821)
Accounts payable (9,826) (18,241) 58,212
Accrued salaries, wages and related benefits 23,763 (203) 17,850
Income tax liabilities and other accruals 43,771 (10,413) 5,309
Other liabilities 14,227 12,088 (7,184)
Net cash provided by operating activities 278,672 419,874 185,287
Investing Activities
Capital expenditures (328,166) (396,048) (330,347)
Additions to deferred lease credits 97,673 126,383 92,361
Proceeds from sale-leaseback of Denver Credit facility 20,000 ——
Minority interest purchase (70,000) ——
Payment for acquisition, net of cash acquired —— (83,828)
Other, net (3,513) (3,104) (1,781)
Net cash used in investing activities (284,006) (272,769) (323,595)
Financing Activities
Proceeds (payments) from notes payable 96 (82,912) 12,126
Proceeds from issuance of long-term debt 1,665 300,000 308,266
Principal payments on long-term debt (87,697) (18,640) (58,191)
Proceeds from sale of interest rate swap 4,931 ——
Proceeds from issuance of common stock 14,663 10,090 5,768
Cash dividends paid (51,322) (48,265) (45,935)
Purchase and retirement of common stock —(1,310) (85,509)
Net cash (used in) provided by financing activities (117,664) 158,963 136,525
Net (decrease) increase in cash and cash equivalents (122,998) 306,068 (1,783)
Cash and cash equivalents at beginning of year 331,327 25,259 27,042
Cash and cash equivalents at end of year $208,329 $331,327 $25,259
The accompanying Notes to Consolidated Financial Statements are an integral part of these statements.