Nordstrom 2002 Annual Report Download - page 35
Download and view the complete annual report
Please find page 35 of the 2002 Nordstrom annual report below. You can navigate through the pages in the report by either clicking on the pages listed below, or by using the keyword search tool below to find specific information within the annual report.-
 1
1 -
2
-
3
-
4
-
5
-
6
-
7
-
8
-
9
-
10
-
11
-
12
-
13
-
14
-
15
-
16
-
17
-
18
-
19
-
20
-
21
-
22
-
23
-
24
-
 25
25 -
 26
26 -
 27
27 -
 28
28 -
 29
29 -
 30
30 -
 31
31 -
 32
32 -
 33
33 -
 34
34 -
 35
35 -
 36
36 -
 37
37 -
 38
38 -
 39
39 -
 40
40 -
 41
41 -
 42
42 -
 43
43 -
 44
44 -
 45
45 -
46
-
47
-
48
-
49
-
50
-
51
-
52
 |
 |

notes to consolidated
financial statements
NORDSTROM INC. AND SUBSIDIARIES 33
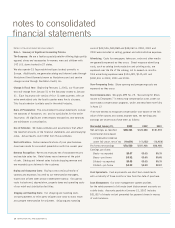
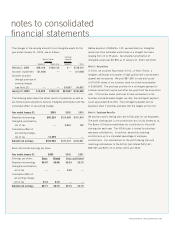
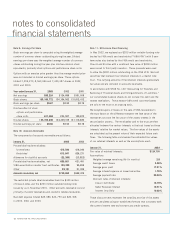
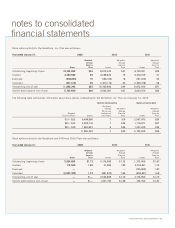
The following table illustrates the sensitivity in the fair market value
estimates of the retained interests given independent changes in
assumptions as of January 31, 2003:
+10% +20% -10% -20%
Gross Yield $1,207 $2,414 $(1,207) $(2,414)
Interest Expense
on Issued Classes (76) (152) 76 152
Card Holders Payment Rate (99) (296) 207 384
Charge Offs (531) (1,059) 533 1,069
Discount Rate (337) (673) 339 680
The following table summarizes certain income, expenses and cash
flows received from and paid to the master note trust.
Year ended January 31, 2003 2002 2001
Principal collections reinvested
in new receivables $824,715 $669,582 $485,422
Gains on sales of receivables 8,290 3,147 5,356
Income earned on
retained interests 10,786 6,711 9,035
Cash flows from retained assets:
Retained interests 28,100 11,916 10,050
Servicing fees 5,407 8,440 8,121
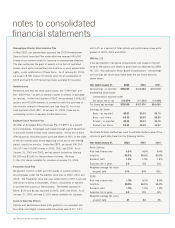
Interest income earned on the retained interests is included in
service charge income and other on the consolidated statements
of earnings.
The total principal balance of the VISA receivables was $323,101
and $258,075 as of January 31, 2003 and 2002. Gross credit
losses were $18,580 and $17,050 for the years ended January 31,
2003 and 2002, and receivables past due for more than 30 days
were $8,519 and $8,170 at January 31, 2003 and 2002.
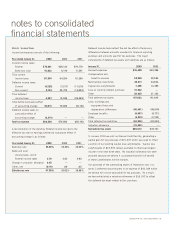
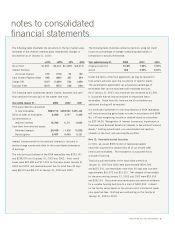
The following table illustrates default projections using net credit
losses as a percentage of average outstanding receivables in
comparison to actual performance:
Year ended January 31, 2004 2003 2002
Original projection 6.16% 7.66% 5.99%
Actual N/A 6.59% 6.62%
Under the terms of the trust agreement, we may be required to
fund certain amounts upon the occurrence of specific events.
The securitization agreements set a maximum percentage of
receivables that can be associated with employee accounts.
As of January 31, 2003, this maximum was exceeded by $1,500.
It is possible that we may be required to repurchase these
receivables. Aside from this instance, we do not believe any
additional funding will be required.
Our continued involvement in the securitization of VISA receivables
will include recording gains/losses on sales in accordance with SFAS
No. 140 and recognizing income on retained assets as prescribed
by EITF 99-20 “Recognition of Interest Income and Impairment on
Purchased and Retained Beneficial Interests in Securitized Financial
Assets,” holding subordinated, non-subordinated and residual
interests in the trust, and servicing the portfolio.
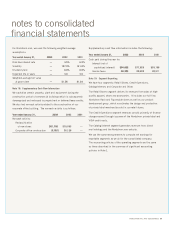
Note 12: Receivable-backed Securities
In 2001, we issued $300 million of receivable-backed
securities supported by substantially all of our private label
credit card receivables. This transaction is accounted for as
a secured financing.
Total principal receivables of the securitized portfolio at
January 31, 2003 and 2002 were approximately $609,784
and $625,516, and receivables more than 30 days past due were
approximately $16,973 and $19,301. Net charged off receivables
for the years ending January 31, 2003 and 2002 were $29,555
and $28,134. The private label receivables also serve as collateral
for a variable funding facility with a limit of $200,000. Interest
on the facility varies based on the actual cost of commercial paper
plus specified fees. Nothing was outstanding on this facility at
January 31, 2003 or 2002.