Nike 2012 Annual Report Download - page 74
Download and view the complete annual report
Please find page 74 of the 2012 Nike annual report below. You can navigate through the pages in the report by either clicking on the pages listed below, or by using the keyword search tool below to find specific information within the annual report.-
 1
1 -
2
-
3
-
4
-
5
-
6
-
7
-
8
-
9
-
10
-
11
-
12
-
13
-
14
-
15
-
16
-
17
-
18
-
19
-
20
-
21
-
22
-
23
-
24
-
25
-
26
-
27
-
28
-
29
-
30
-
31
-
32
-
33
-
34
-
35
-
36
-
37
-
38
-
39
-
40
-
41
-
42
-
43
-
44
-
45
-
46
-
47
-
48
-
49
-
50
-
51
-
52
-
53
-
54
-
55
-
56
-
57
-
58
-
59
-
60
-
61
-
62
-
63
-
 64
64 -
 65
65 -
 66
66 -
 67
67 -
 68
68 -
 69
69 -
 70
70 -
 71
71 -
 72
72 -
 73
73 -
 74
74 -
 75
75 -
 76
76 -
 77
77 -
 78
78
 |
 |

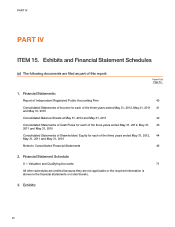
PART IV
EXHIBIT 12.1 NIKE, Inc. Computation of Ratio of Earnings to Fixed Charges
Year Ended May 31,
(In millions) 2012 2011 2010 2009 2008
Net income $ 2,223 $ 2,133 $ 1,907 $ 1,487 $ 1,883
Income taxes 760 711 610 470 620
Income before income taxes 2,983 2,844 2,517 1,957 2,503
Add fixed charges
Interest expense(1) 32 34 36 40 41
Interest component of leases(2) 50 45 42 40 34
TOTAL FIXED CHARGES 82 79 78 80 75
Earnings before income taxes and fixed charges(3) $ 3,065 $ 2,923 $ 2,595 $ 2,037 $ 2,578
Ratio of earnings to total fixed charges 37.4 37.0 33.3 25.5 34.4
(1) Interest expense includes interest both expensed and capitalized.
(2) Interest component of leases includes one-tenth of rental expense which approximates the interest component of operating leases.
(3) Earnings before income taxes and fixed charges are exclusive of capitalized interest.
74