Nike 2012 Annual Report Download - page 41
Download and view the complete annual report
Please find page 41 of the 2012 Nike annual report below. You can navigate through the pages in the report by either clicking on the pages listed below, or by using the keyword search tool below to find specific information within the annual report.-
 1
1 -
2
-
3
-
4
-
5
-
6
-
7
-
8
-
9
-
10
-
11
-
12
-
13
-
14
-
15
-
16
-
17
-
18
-
19
-
20
-
21
-
22
-
23
-
24
-
25
-
26
-
27
-
28
-
29
-
30
-
 31
31 -
 32
32 -
 33
33 -
 34
34 -
 35
35 -
 36
36 -
 37
37 -
 38
38 -
 39
39 -
 40
40 -
 41
41 -
 42
42 -
 43
43 -
 44
44 -
 45
45 -
 46
46 -
 47
47 -
 48
48 -
 49
49 -
 50
50 -
 51
51 -
52
-
53
-
54
-
55
-
56
-
57
-
58
-
59
-
60
-
61
-
62
-
63
-
64
-
65
-
66
-
67
-
68
-
69
-
70
-
71
-
72
-
73
-
74
-
75
-
76
-
77
-
78
 |
 |

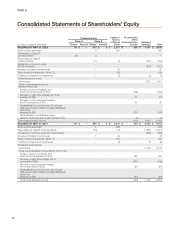
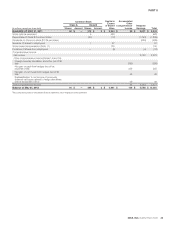
PART II
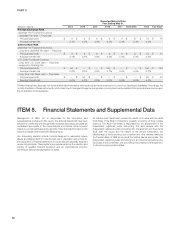
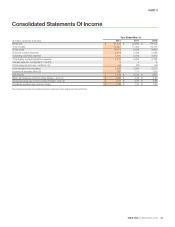
Consolidated Statements Of Income
Year Ended May 31,
(In millions, except per share data) 2012 2011 2010
Revenues $ 24,128 $ 20,862 $ 19,014
Cost of sales 13,657 11,354 10,214
Gross profit 10,471 9,508 8,800
Demand creation expense 2,711 2,448 2,356
Operating overhead expense 4,720 4,245 3,970
Total selling and administrative expense 7,431 6,693 6,326
Interest expense, net (Notes 6, 7 and 8) 3 4 6
Other expense (income), net (Note 16) 54 (33) (49)
Income before income taxes 2,983 2,844 2,517
Income tax expense (Note 9) 760 711 610
Net income $ 2,223 $ 2,133 $ 1,907
Basic earnings per common share (Notes 1 and 12) $ 4.83 $ 4.48 $ 3.93
Diluted earnings per common share (Notes 1 and 12) $ 4.73 $ 4.39 $ 3.86
Dividends declared per common share $ 1.39 $ 1.20 $ 1.06
The accompanying notes to consolidated financial statements are an integral part of this statement.
NIKE, INC. Š2012 Form 10-K 41