Nike 2012 Annual Report Download - page 53
Download and view the complete annual report
Please find page 53 of the 2012 Nike annual report below. You can navigate through the pages in the report by either clicking on the pages listed below, or by using the keyword search tool below to find specific information within the annual report.-
 1
1 -
2
-
3
-
4
-
5
-
6
-
7
-
8
-
9
-
10
-
11
-
12
-
13
-
14
-
15
-
16
-
17
-
18
-
19
-
20
-
21
-
22
-
23
-
24
-
25
-
26
-
27
-
28
-
29
-
30
-
31
-
32
-
33
-
34
-
35
-
36
-
37
-
38
-
39
-
40
-
41
-
42
-
 43
43 -
 44
44 -
 45
45 -
 46
46 -
 47
47 -
 48
48 -
 49
49 -
 50
50 -
 51
51 -
 52
52 -
 53
53 -
 54
54 -
 55
55 -
 56
56 -
 57
57 -
 58
58 -
 59
59 -
 60
60 -
 61
61 -
 62
62 -
 63
63 -
64
-
65
-
66
-
67
-
68
-
69
-
70
-
71
-
72
-
73
-
74
-
75
-
76
-
77
-
78
 |
 |

PART II
May 31, 2011
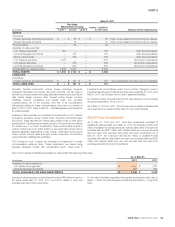
Fair Value
Measurements Using Assets / Liabilities
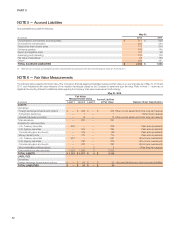
at Fair Value(In millions) Level 1 Level 2 Level 3 Balance Sheet Classification
ASSETS
Derivatives:
Foreign exchange forwards and options $ — $ 38 $ — $ 38 Other current assets and other long-term assets
Interest rate swap contracts — 15 — 15 Other current assets and other long-term assets
Total derivatives — 53 — 53
Available-for-sale securities:
U.S. Treasury securities 125 — — 125 Cash and equivalents
Commercial paper and bonds — 157 — 157 Cash and equivalents
Money market funds — 780 — 780 Cash and equivalents
U.S. Treasury securities 1,473 — — 1,473 Short-term investments
U.S. Agency securities — 308 — 308 Short-term investments
Commercial paper and bonds — 802 — 802 Short-term investments
Total available-for-sale securities 1,598 2,047 — 3,645
TOTAL ASSETS $ 1,598 $ 2,100 $ — $ 3,698
LIABILITIES
Derivatives:
Foreign exchange forwards and options $ — $ 197 $ — $ 197 Accrued liabilities and other long-term liabilities
TOTAL LIABILITIES $ — $ 197 $ — $ 197
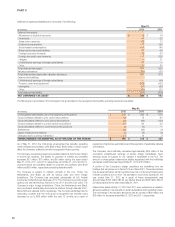
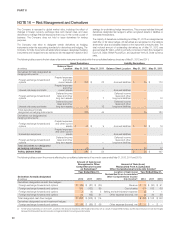
Derivative financial instruments include foreign exchange forwards,
embedded derivatives and interest rate swap contracts. The fair value of
derivative contracts is determined using observable market inputs such as the
daily market foreign currency rates, forward pricing curves, currency
volatilities, currency correlations and interest rates, and considers
nonperformance risk of the Company and that of its counterparties.
Adjustments relating to these nonperformance risks were not material at
May 31, 2012 or 2011. Refer to Note 16 — Risk Management and Derivatives
for additional detail.
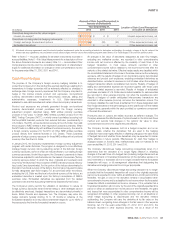
Available-for-sale securities are comprised of investments in U.S. Treasury
and agency securities, money market funds, corporate commercial paper
and bonds. These securities are valued using market prices on both active
markets (Level 1) and less active markets (Level 2). Pricing vendors are utilized
for certain Level 1 or Level 2 investments. These vendors either provide a
quoted market price in an active market or use observable inputs without
applying significant adjustments in their pricing. Observable inputs include
broker quotes, interest rates and yield curves observable at commonly
quoted intervals, volatilities and credit risks.
The Company’s Level 3 assets are comprised of investments in certain
non-marketable preferred stock. These investments are valued using
internally developed models with unobservable inputs. These Level 3
investments are an immaterial portion of our portfolio. Changes in Level 3
investment assets were immaterial during the year ended May 31, 2012. As of
May 31, 2011, the Company had no Level 3 assets and liabilities.
No transfers among the levels within the fair value hierarchy occurred during
the years ended May 31, 2012 or 2011.
As of May 31, 2012 and 2011, the Company had no assets or liabilities that
were required to be measured at fair value on a non-recurring basis.
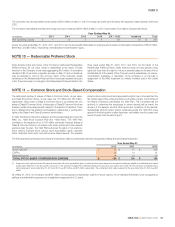
Short-Term Investments
As of May 31, 2012 and 2011, short-term investments consisted of
available-for-sale securities. As of May 31, 2012, the Company held $1,129
million of available-for-sale securities with maturity dates within one year from
purchase date and $311 million with maturity dates over one year and less
than five years from purchase date within short-term investments. As of
May 31, 2011, the Company held $2,253 million of available-for-sale
securities with maturity dates within one year from purchase date and $330
million with maturity dates over one year and less than five years from
purchase date within short-term investments.
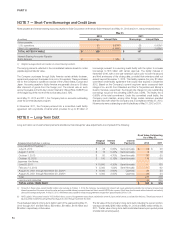
Short-term investments classified as available-for-sale consist of the following at fair value:
As of May 31,
(In millions) 2012 2011
Available-for-sale investments:
U.S. treasury and agencies $ 1,157 $ 1,781
Commercial paper and bonds 283 802
TOTAL AVAILABLE-FOR-SALE INVESTMENTS $ 1,440 $ 2,583
Included in interest expense, net was interest income of $30 million for each of
the years ended May 31, 2012, 2011, and 2010, related to cash and
equivalents and short-term investments.
For fair value information regarding notes payable and long-term debt, refer to
Note 7 — Short-Term Borrowings and Credit Lines and Note 8 — Long-Term
Debt.
NIKE, INC. Š2012 Form 10-K 53