Nike 2012 Annual Report Download - page 28
Download and view the complete annual report
Please find page 28 of the 2012 Nike annual report below. You can navigate through the pages in the report by either clicking on the pages listed below, or by using the keyword search tool below to find specific information within the annual report.-
 1
1 -
2
-
3
-
4
-
5
-
6
-
7
-
8
-
9
-
10
-
11
-
12
-
13
-
14
-
15
-
16
-
17
-
 18
18 -
 19
19 -
 20
20 -
 21
21 -
 22
22 -
 23
23 -
 24
24 -
 25
25 -
 26
26 -
 27
27 -
 28
28 -
 29
29 -
 30
30 -
 31
31 -
 32
32 -
 33
33 -
 34
34 -
 35
35 -
 36
36 -
 37
37 -
 38
38 -
39
-
40
-
41
-
42
-
43
-
44
-
45
-
46
-
47
-
48
-
49
-
50
-
51
-
52
-
53
-
54
-
55
-
56
-
57
-
58
-
59
-
60
-
61
-
62
-
63
-
64
-
65
-
66
-
67
-
68
-
69
-
70
-
71
-
72
-
73
-
74
-
75
-
76
-
77
-
78
 |
 |

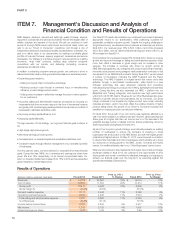
PART II
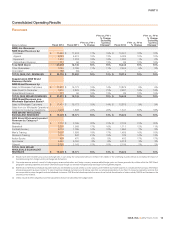
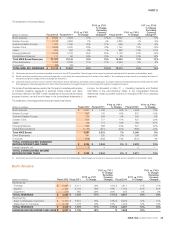
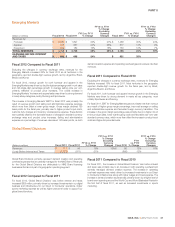
Other Businesses
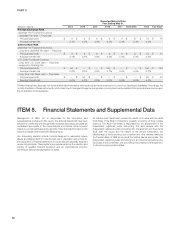
(Dollars in millions) Fiscal 2012 Fiscal 2011
FY12 vs. FY11
% Change
FY12 vs. FY11 %
Change
Excluding
Currency
Changes Fiscal 2010
FY11 vs. FY10
% Change
FY11 vs. FY10
% Change
Excluding
Currency
Changes
Revenues
Converse $ 1,324 $ 1,131 17% 17% $ 983 15% 15%
NIKE Golf 726 658 10% 9% 670 -2% -3%
Cole Haan 535 521 3% 3% 466 12% 12%
Hurley 248 252 -2% -1% 222 14% 13%
Umbro 262 224 17% 14% 223 0% 2%
TOTAL REVENUES $ 3,095 $ 2,786 11% 11% $ 2,564 9% 8%
EARNINGS BEFORE
INTEREST AND TAXES $ 341 $ 335 2% $ 298 12%
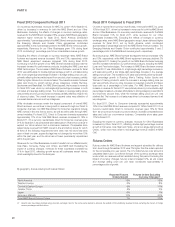
Fiscal 2012 Compared to Fiscal 2011
Our Other Businesses are comprised of our affiliate brands; Cole Haan,
Converse, Hurley and Umbro; and NIKE Golf.
For fiscal 2012, revenues for our Other Businesses increased 11%, reflecting
growth across most businesses, led by Converse. The revenue growth at
Converse was primarily driven by increased sales in North America and China,
as well as increased revenues in the U.K. as we transitioned that market to
direct distribution in the second half of fiscal 2011. Excluding changes in
currency exchange rates, revenues for NIKE Golf increased 9% for fiscal
2012, driven by double-digit percentage growth in our apparel business,
partially offset by a single-digit percentage decline in our club business. On a
currency neutral basis, revenues for Umbro grew 14% primarily driven by
sales growth in France due to our acquisition of the exclusive licensee and
distributor in March 2011. For fiscal 2012, revenues for Cole Haan grew 3%,
mostly driven by growth in our Direct to Consumer operations.
On a reported basis, revenues for our Other Businesses increased 11% for
fiscal 2012, while EBIT grew 2%, as earnings growth at Converse was mostly
offset by losses at Umbro and Hurley. Higher selling and administrative
expense as a percentage of revenues negatively affected profitability at both
companies, while lower gross margins also contributed to the decline in
Hurley’s earnings.
As part of our long-term growth strategy, we continually evaluate our existing
portfolio of businesses to ensure the Company is investing in those
businesses that are accretive to the NIKE Brand, and with the largest growth
potential and highest returns. On May 31, 2012, we announced our intention
to divest of the Cole Haan and Umbro businesses, which will allow us to focus
our resources on driving growth in the NIKE, Jordan, Converse and Hurley
brands. For fiscal 2012 and 2011, Cole Haan and Umbro combined
contributed $797 million and $745 million, respectively, in revenues to the
Other Businesses portfolio, and losses before interest and taxes of $43 million
and $18 million, respectively.
We are currently in the process of preparing these businesses for sale and
identifying suitable buyers. Although we are unable to estimate the ultimate
gains or losses on the sales of these businesses at this time, we anticipate we
will in the future incur certain non-cash charges related to the divestiture of
Umbro. Upon the sale of the business, or when the ultimate selling price
becomes estimable, we expect to incur non-cash charges to liquidate certain
balance sheet accounts, most significantly the cumulative translation
adjustment and deferred tax assets related to Umbro. At May 31, 2012, the
cumulative translation adjustment was $110 million, net of tax, and the
deferred tax asset was $32 million. We may also incur other cash and
non-cash charges related to the divestiture of the Cole Haan and Umbro
businesses.
Fiscal 2011 Compared to Fiscal 2010
For fiscal 2011, the revenue growth at Converse was primarily driven by
increased licensing revenue in China, as well as increased sales in the U.K. as
we transitioned that market to direct distribution. Revenues for Cole Haan
increased 12%, driven by double-digit percentage growth in our wholesale
operations as well as high-single-digit percentage growth in our Direct to
Consumer operations. Revenues declined at NIKE Golf, where we
experienced significant erosion in our Japan business following the
earthquake and tsunami in March 2011.
For fiscal 2011, EBIT for our Other Businesses grew at a faster rate than
revenues, primarily as a result of more favorable foreign currency exchange
impacts. Gross margin remained relatively flat for fiscal 2011, as the favorable
impact from improved product mix was offset by a lower mix of licensee
revenues. Selling and administrative expense as a percentage of revenues
remained relatively flat for fiscal 2011.
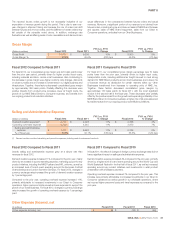
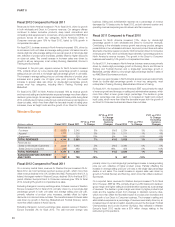
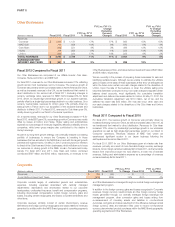
Corporate
(Dollars in millions) Fiscal 2012 Fiscal 2011
FY12 vs. FY11
% Change Fiscal 2010
FY11 vs. FY10
% Change
Revenues $ (39) $ (69) — $ 7 —
(Loss) Before Interest and Taxes (916) (805) -14% (841) 4%
Corporate consists largely of unallocated general and administrative
expenses, including expenses associated with centrally managed
departments; depreciation and amortization related to our corporate
headquarters; unallocated insurance, benefit and compensation programs,
including stock-based compensation; certain foreign currency gains and
losses, including certain hedge gains and losses; corporate eliminations and
other items.
Corporate revenues primarily consist of certain intercompany revenue
eliminations and foreign currency hedge gains and losses related to revenues
generated by entities within the NIKE Brand geographic operating segments
and Other Businesses but managed through our central foreign exchange risk
management program.
In addition to the foreign currency gains and losses recognized in Corporate
revenues, foreign currency results include all other foreign currency hedge
results generated through our centrally managed foreign exchange risk
management program, other conversion gains and losses arising from
re-measurement of monetary assets and liabilities in non-functional
currencies, and gains and losses resulting from the difference between actual
foreign currency rates and standard rates used to record non-functional
currency denominated product purchases within the NIKE Brand geographic
operating segments and Other Businesses.
28