Nike 2012 Annual Report Download - page 23
Download and view the complete annual report
Please find page 23 of the 2012 Nike annual report below. You can navigate through the pages in the report by either clicking on the pages listed below, or by using the keyword search tool below to find specific information within the annual report.-
 1
1 -
2
-
3
-
4
-
5
-
6
-
7
-
8
-
9
-
10
-
11
-
12
-
 13
13 -
 14
14 -
 15
15 -
 16
16 -
 17
17 -
 18
18 -
 19
19 -
 20
20 -
 21
21 -
 22
22 -
 23
23 -
 24
24 -
 25
25 -
 26
26 -
 27
27 -
 28
28 -
 29
29 -
 30
30 -
 31
31 -
 32
32 -
 33
33 -
34
-
35
-
36
-
37
-
38
-
39
-
40
-
41
-
42
-
43
-
44
-
45
-
46
-
47
-
48
-
49
-
50
-
51
-
52
-
53
-
54
-
55
-
56
-
57
-
58
-
59
-
60
-
61
-
62
-
63
-
64
-
65
-
66
-
67
-
68
-
69
-
70
-
71
-
72
-
73
-
74
-
75
-
76
-
77
-
78
 |
 |

PART II
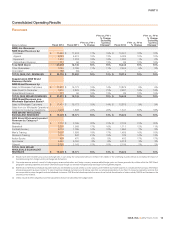
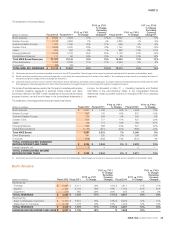
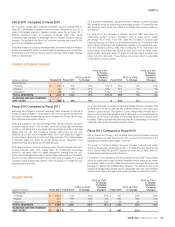
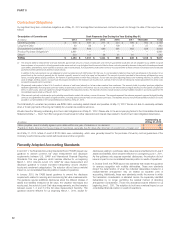
The breakdown of revenues follows:
(Dollars in millions) Fiscal 2012 Fiscal 2011(1)
FY12 vs. FY11
% Change
FY12 vs. FY11
% Change
Excluding
Currency
Changes(2) Fiscal 2010(1)
FY11 vs. FY10
% Change
FY11 vs. FY10
% Change
Excluding
Currency
Changes(2)
North America $ 8,839 $ 7,579 17% 17% $ 6,697 13% 13%
Western Europe 4,144 3,868 7% 4% 3,839 1% 6%
Central & Eastern Europe 1,200 1,040 15% 17% 999 4% 6%
Greater China 2,539 2,060 23% 18% 1,742 18% 16%
Japan 829 766 8% 1% 882 -13% -21%
Emerging Markets 3,410 2,736 25% 26% 2,198 24% 19%
Global Brand Divisions 111 96 16% 13% 86 12% 16%
Total NIKE Brand Revenues 21,072 18,145 16% 15% 16,443 10% 10%
Other Businesses 3,095 2,786 11% 11% 2,564 9% 8%
Corporate(3) (39) (69) — — 7 — —
TOTAL NIKE, INC. REVENUES $ 24,128 $ 20,862 16% 14% $ 19,014 10% 10%
(1) Certain prior year amounts have been reclassified to conform to fiscal 2012 presentation. These changes had no impact on previously reported results of operations or shareholders’ equity.
(2) Results have been restated using actual exchange rates in use during the comparative period to enhance the visibility of the underlying business trends by excluding the impact of
translation arising from foreign currency exchange rate fluctuations.
(3) Corporate revenues primarily consist of certain intercompany revenue eliminations and foreign currency hedge gains and losses related to revenues generated by entities within the NIKE
Brand geographic operating segments and certain Other Businesses but managed through our central foreign exchange risk management program.
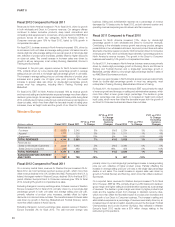
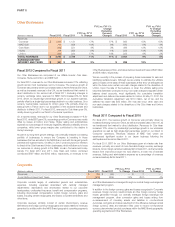
The primary financial measure used by the Company to evaluate performance
of individual operating segments is earnings before interest and taxes
(commonly referred to as “EBIT”) which represents net income before interest
expense (income), net and income taxes in the consolidated statements of
income. As discussed in Note 17 — Operating Segments and Related
Information in the accompanying Notes to the Consolidated Financial
Statements, certain corporate costs are not included in EBIT of our operating
segments.
The breakdown of earnings before interest and taxes is as follows:
(Dollars in millions) Fiscal 2012 Fiscal 2011(1)
FY12 vs. FY11
% Change Fiscal 2010(1)
FY11 vs. FY10
% Change
North America $ 2,007 $ 1,736 16% $ 1,538 13%
Western Europe 597 730 -18% 807 -10%
Central & Eastern Europe 234 244 -4% 249 -2%
Greater China 911 777 17% 637 22%
Japan 136 114 19% 180 -37%
Emerging Markets 853 688 24% 521 32%
Global Brand Divisions (1,177) (971) -21% (866) -12%
Total NIKE Brand 3,561 3,318 7% 3,066 8%
Other Businesses 341 335 2% 298 12%
Corporate (916) (805) -14% (841) 4%
TOTAL CONSOLIDATED EARNINGS
BEFORE INTEREST AND TAXES $ 2,986 $ 2,848 5% $ 2,523 13%
Interest expense, net 3 4 — 6 —
TOTAL CONSOLIDATED INCOME
BEFORE INCOME TAXES $ 2,983 $ 2,844 5% $ 2,517 13%
(1) Certain prior year amounts have been reclassified to conform to fiscal 2012 presentation. These changes had no impact on previously reported results of operations or shareholders’ equity.
North America
(Dollars in millions) Fiscal 2012 Fiscal 2011
FY12 vs. FY11
% Change
FY12 vs. FY11
% Change
Excluding
Currency
Changes Fiscal 2010
FY11 vs. FY10
% Change
FY11 vs. FY10
%Change
Excluding
Currency
Changes
Revenues by:
Footwear $ 5,887 $ 5,111 15% 15% $ 4,611 11% 11%
Apparel 2,482 2,103 18% 18% 1,740 21% 21%
Equipment 470 365 29% 29% 346 5% 5%
TOTAL REVENUES $ 8,839 $ 7,579 17% 17% $ 6,697 13% 13%
Revenues by:
Sales to Wholesale Customers $ 6,720 $ 5,801 16% 16% $ 5,202 12% 11%
Sales Direct to Consumer 2,119 1,778 19% 19% 1,495 19% 19%
TOTAL REVENUES $ 8,839 $ 7,579 17% 17% $ 6,697 13% 13%
EARNINGS BEFORE INTEREST AND TAXES $ 2,007 $ 1,736 16% $ 1,538 13%
NIKE, INC. Š2012 Form 10-K 23