Nike 2012 Annual Report Download - page 52
Download and view the complete annual report
Please find page 52 of the 2012 Nike annual report below. You can navigate through the pages in the report by either clicking on the pages listed below, or by using the keyword search tool below to find specific information within the annual report.-
 1
1 -
2
-
3
-
4
-
5
-
6
-
7
-
8
-
9
-
10
-
11
-
12
-
13
-
14
-
15
-
16
-
17
-
18
-
19
-
20
-
21
-
22
-
23
-
24
-
25
-
26
-
27
-
28
-
29
-
30
-
31
-
32
-
33
-
34
-
35
-
36
-
37
-
38
-
39
-
40
-
41
-
 42
42 -
 43
43 -
 44
44 -
 45
45 -
 46
46 -
 47
47 -
 48
48 -
 49
49 -
 50
50 -
 51
51 -
 52
52 -
 53
53 -
 54
54 -
 55
55 -
 56
56 -
 57
57 -
 58
58 -
 59
59 -
 60
60 -
 61
61 -
 62
62 -
63
-
64
-
65
-
66
-
67
-
68
-
69
-
70
-
71
-
72
-
73
-
74
-
75
-
76
-
77
-
78
 |
 |

PART II
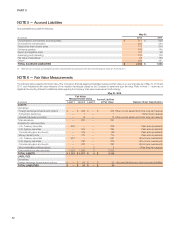
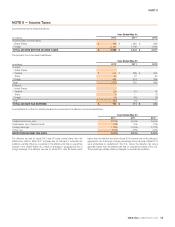
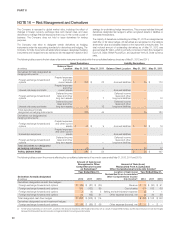
NOTE 5 — Accrued Liabilities
Accrued liabilities included the following:
May 31,
(In millions) 2012 2011
Compensation and benefits, excluding taxes $ 711 $ 628
Endorsement compensation 294 284
Taxes other than income taxes 179 214
Dividends payable 165 145
Import and logistics costs 133 98
Advertising and marketing 132 139
Fair value of derivatives 55 186
Other(1) 384 291
TOTAL ACCRUED LIABILITIES $ 2,053 $ 1,985
(1) Other consists of various accrued expenses with no individual item accounting for more than 5% of the balance at May 31, 2012 and 2011.
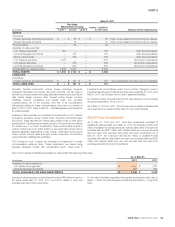
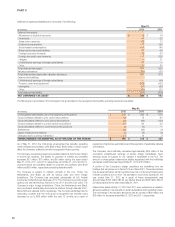
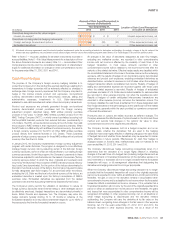
NOTE 6 — Fair Value Measurements
The following table presents information about the Company’s financial assets and liabilities measured at fair value on a recurring basis as of May 31, 2012 and
2011, and indicates the fair value hierarchy of the valuation techniques utilized by the Company to determine such fair value. Refer to Note 1 – Summary of
Significant Accounting Policies for additional detail regarding the Company’s fair value measurement methodology.
May 31, 2012
Fair Value
Measurements Using Assets/Liabilities
at Fair Value
(In millions) Level 1 Level 2 Level 3 Balance Sheet Classification
ASSETS
Derivatives:
Foreign exchange forwards and options $ — $ 265 $ — $ 265 Other current assets and other long-term assets
Embedded derivatives — 1 — 1 Other current assets
Interest rate swap contracts — 15 — 15 Other current assets and other long-term assets
Total derivatives — 281 — 281
Available-for-sale securities:
U.S. Treasury securities 226 — — 226 Cash and equivalents
U.S. Agency securities — 254 — 254 Cash and equivalents
Commercial paper and bonds — 159 — 159 Cash and equivalents
Money market funds — 770 — 770 Cash and equivalents
U.S. Treasury securities 927 — — 927 Short-term investments
U.S. Agency securities — 230 — 230 Short-term investments
Commercial paper and bonds — 283 — 283 Short-term investments
Non-marketable preferred stock — — 3 3 Other long-term assets
Total available-for-sale securities 1,153 1,696 3 2,852
TOTAL ASSETS $ 1,153 $ 1,977 $ 3 $ 3,133
LIABILITIES
Derivatives:
Foreign exchange forwards and options $ — $ 55 $ — $ 55 Accrued liabilities and other long-term liabilities
TOTAL LIABILITIES $—$55$—$ 55
52