Nike 2012 Annual Report Download - page 27
Download and view the complete annual report
Please find page 27 of the 2012 Nike annual report below. You can navigate through the pages in the report by either clicking on the pages listed below, or by using the keyword search tool below to find specific information within the annual report.-
 1
1 -
2
-
3
-
4
-
5
-
6
-
7
-
8
-
9
-
10
-
11
-
12
-
13
-
14
-
15
-
16
-
 17
17 -
 18
18 -
 19
19 -
 20
20 -
 21
21 -
 22
22 -
 23
23 -
 24
24 -
 25
25 -
 26
26 -
 27
27 -
 28
28 -
 29
29 -
 30
30 -
 31
31 -
 32
32 -
 33
33 -
 34
34 -
 35
35 -
 36
36 -
 37
37 -
38
-
39
-
40
-
41
-
42
-
43
-
44
-
45
-
46
-
47
-
48
-
49
-
50
-
51
-
52
-
53
-
54
-
55
-
56
-
57
-
58
-
59
-
60
-
61
-
62
-
63
-
64
-
65
-
66
-
67
-
68
-
69
-
70
-
71
-
72
-
73
-
74
-
75
-
76
-
77
-
78
 |
 |

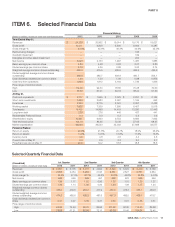
PART II
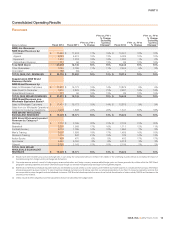
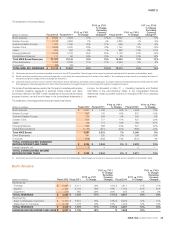
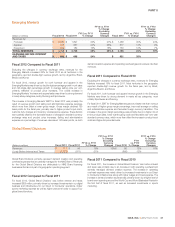
Emerging Markets
(Dollars in millions) Fiscal 2012 Fiscal 2011
FY12 vs. FY11
% Change
FY12 vs. FY11
% Change
Excluding
Currency
Changes Fiscal 2010
FY11 vs. FY10
% Change
FY11 vs. FY10
% Change
Excluding
Currency
Changes
Revenues by:
Footwear $ 2,386 $ 1,897 26% 27% $ 1,458 30% 24%
Apparel 815 657 24% 25% 577 14% 9%
Equipment 209 182 15% 15% 163 12% 7%
TOTAL REVENUES $ 3,410 $ 2,736 25% 26% $ 2,198 24% 19%
EARNINGS BEFORE INTEREST
AND TAXES $ 853 $ 688 24% $ 521 32%
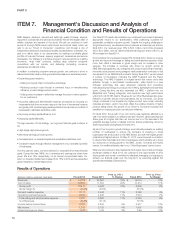
Fiscal 2012 Compared to Fiscal 2011
Excluding the changes in currency exchange rates, revenues for the
Emerging Markets increased 26% for fiscal 2012 as all territories in the
geography reported double-digit revenue growth, led by Argentina, Brazil,
Mexico and Korea.
For fiscal 2012, revenue growth for both footwear and apparel in the
Emerging Markets was driven by double-digit percentage growth in unit sales
and mid-single-digit percentage growth in average selling price per unit,
primarily reflective of product price increases. The overall increase in
Emerging Markets’ footwear and apparel sales was driven by strong demand
in nearly all key categories, led by Running and Sportswear.
The increase in Emerging Markets’ EBIT for fiscal 2012 was primarily the
result of revenue growth and selling and administrative expense leverage,
which more than offset a lower gross margin. Gross margin declined 150
basis points for the fiscal year, primarily due to higher product input costs,
customs duty charges and inventory obsolescence expense. These factors
were partially offset by the favorable impact of changes in standard currency
exchange rates and product price increases. Selling and administrative
expense as a percentage of revenues decreased 140 basis points, as both
demand creation expense and operating overhead grew at a slower rate than
revenues.
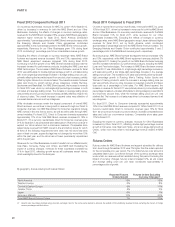
Fiscal 2011 Compared to Fiscal 2010
Excluding the changes in currency exchange rates, revenues for Emerging
Markets increased 19% for fiscal 2011. Most territories in the geography
reported double-digit revenue growth for the fiscal year, led by Brazil,
Argentina, Mexico, and Korea.
For fiscal 2011, both footwear and apparel revenue growth in the Emerging
Markets was driven by strong demand in nearly all key categories, most
notably Sportswear and Running.
For fiscal 2011, EBIT for Emerging Markets grew at a faster rate than revenue
as a result of higher gross margin percentage, improved leverage on selling
and administrative expense and favorable foreign currency translation. The
increase in the gross margin percentage was primarily due to a higher mix of
in-line product sales, lower warehousing costs and favorable year-over-year
standard currency rates, which more than offset the increase in product input
costs and higher full-price discounts.
Global Brand Divisions
(Dollars in millions) Fiscal 2012 Fiscal 2011
FY12 vs. FY11
% Change
FY12 vs. FY11
% Change
Excluding
Currency
Changes Fiscal 2010
FY11
vs. FY10
% Change
FY11 vs. FY10
% Change
Excluding
Currency
Changes
Revenues $ 111 $ 96 16% 13%$ 86 12% 16%
(Loss) Before Interest and Taxes (1,177) (971) -21% (866) -12%
Global Brand Divisions primarily represent demand creation and operating
overhead expenses that are centrally managed for the NIKE Brand. Revenues
for the Global Brand Divisions are attributable to NIKE Brand licensing
businesses that are not part of a geographic operating segment.
Fiscal 2012 Compared to Fiscal 2011
For fiscal 2012, Global Brand Divisions’ loss before interest and taxes
increased $206 million, primarily driven by increased investments in our digital
business and infrastructure for our Direct to Consumer operations, higher
sports marketing expense as well as higher personnel costs to support our
global brand functions.
Fiscal 2011 Compared to Fiscal 2010
For fiscal 2011, the increase in Global Brand Divisions’ loss before interest
and taxes was primarily due to an increase in both operating overhead and
centrally managed demand creation expense. The increase in operating
overhead expense was mainly driven by increased investments in our Direct
to Consumer infrastructure along with higher wages and travel expense. The
increase in demand creation expense was primarily driven by a higher level of
brand event spending around the World Cup and World Basketball Festival in
the first half of fiscal 2011, as well as increased investments in sports
marketing.
NIKE, INC. Š2012 Form 10-K 27