Nike 2012 Annual Report Download - page 64
Download and view the complete annual report
Please find page 64 of the 2012 Nike annual report below. You can navigate through the pages in the report by either clicking on the pages listed below, or by using the keyword search tool below to find specific information within the annual report.-
 1
1 -
2
-
3
-
4
-
5
-
6
-
7
-
8
-
9
-
10
-
11
-
12
-
13
-
14
-
15
-
16
-
17
-
18
-
19
-
20
-
21
-
22
-
23
-
24
-
25
-
26
-
27
-
28
-
29
-
30
-
31
-
32
-
33
-
34
-
35
-
36
-
37
-
38
-
39
-
40
-
41
-
42
-
43
-
44
-
45
-
46
-
47
-
48
-
49
-
50
-
51
-
52
-
53
-
 54
54 -
 55
55 -
 56
56 -
 57
57 -
 58
58 -
 59
59 -
 60
60 -
 61
61 -
 62
62 -
 63
63 -
 64
64 -
 65
65 -
 66
66 -
 67
67 -
 68
68 -
 69
69 -
 70
70 -
 71
71 -
 72
72 -
 73
73 -
 74
74 -
75
-
76
-
77
-
78
 |
 |

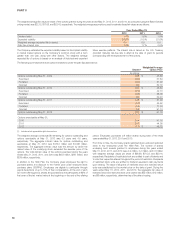
PART II
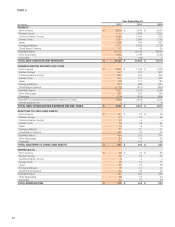
Year Ended May 31,
(In millions) 2012 2011 2010
REVENUE
North America $ 8,839 $ 7,579 $ 6,697
Western Europe 4,144 3,868 3,839
Central & Eastern Europe 1,200 1,040 999
Greater China 2,539 2,060 1,742
Japan 829 766 882
Emerging Markets 3,410 2,736 2,198
Global Brand Divisions 111 96 86
Total NIKE Brand 21,072 18,145 16,443
Other Businesses 3,095 2,786 2,564
Corporate (39) (69) 7
TOTAL NIKE CONSOLIDATED REVENUES $ 24,128 $ 20,862 $ 19,014
EARNINGS BEFORE INTEREST AND TAXES
North America $ 2,007 $ 1,736 $ 1,538
Western Europe 597 730 807
Central & Eastern Europe 234 244 249
Greater China 911 777 637
Japan 136 114 180
Emerging Markets 853 688 521
Global Brand Divisions (1,177) (971) (866)
Total NIKE Brand 3,561 3,318 3,066
Other Businesses 341 335 298
Corporate (916) (805) (841)
Total NIKE Consolidated Earnings Before Interest and Taxes 2,986 2,848 2,523
Interest expense, net 346
TOTAL NIKE CONSOLIDATED EARNINGS BEFORE TAXES $ 2,983 $ 2,844 $ 2,517
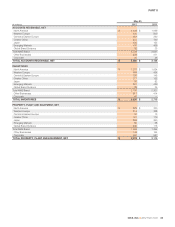
ADDITIONS TO LONG-LIVED ASSETS
North America $ 131 $ 79 $ 45
Western Europe 93 75 59
Central & Eastern Europe 20 5 4
Greater China 38 43 80
Japan 14 9 12
Emerging Markets 27 21 11
Global Brand Divisions 131 44 30
Total NIKE Brand 454 276 241
Other Businesses 34 38 52
Corporate 109 118 42
TOTAL ADDITIONS TO LONG-LIVED ASSETS $ 597 $ 432 $ 335
DEPRECIATION
North America $ 78 $ 70 $ 65
Western Europe 62 52 57
Central & Eastern Europe 644
Greater China 25 19 11
Japan 23 22 26
Emerging Markets 15 14 12
Global Brand Divisions 53 39 33
Total NIKE Brand 262 220 208
Other Businesses 45 44 46
Corporate 66 71 70
TOTAL DEPRECIATION $ 373 $ 335 $ 324
64