Nike 2012 Annual Report Download - page 17
Download and view the complete annual report
Please find page 17 of the 2012 Nike annual report below. You can navigate through the pages in the report by either clicking on the pages listed below, or by using the keyword search tool below to find specific information within the annual report.-
 1
1 -
2
-
3
-
4
-
5
-
6
-
 7
7 -
 8
8 -
 9
9 -
 10
10 -
 11
11 -
 12
12 -
 13
13 -
 14
14 -
 15
15 -
 16
16 -
 17
17 -
 18
18 -
 19
19 -
 20
20 -
 21
21 -
 22
22 -
 23
23 -
 24
24 -
 25
25 -
 26
26 -
 27
27 -
28
-
29
-
30
-
31
-
32
-
33
-
34
-
35
-
36
-
37
-
38
-
39
-
40
-
41
-
42
-
43
-
44
-
45
-
46
-
47
-
48
-
49
-
50
-
51
-
52
-
53
-
54
-
55
-
56
-
57
-
58
-
59
-
60
-
61
-
62
-
63
-
64
-
65
-
66
-
67
-
68
-
69
-
70
-
71
-
72
-
73
-
74
-
75
-
76
-
77
-
78
 |
 |

PART II
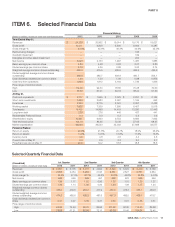
ITEM 6. Selected Financial Data
(Dollars in millions, except per share data and financial ratios)
Financial History
2012 2011 2010 2009 2008
Year Ended May 31,
Revenues $ 24,128 $ 20,862 $ 19,014 $ 19,176 $ 18,627
Gross profit 10,471 9,508 8,800 8,604 8,387
Gross margin % 43.4% 45.6% 46.3% 44.9% 45.0%
Restructuring charges — — — 195 —
Goodwill impairment — — — 199 —
Intangible and other asset impairment — — — 202 —
Net income 2,223 2,133 1,907 1,487 1,883
Basic earnings per common share 4.83 4.48 3.93 3.07 3.80
Diluted earnings per common share 4.73 4.39 3.86 3.03 3.74
Weighted average common shares outstanding 460.0 475.5 485.5 484.9 495.6
Diluted weighted average common shares
outstanding 469.8 485.7 493.9 490.7 504.1
Cash dividends declared per common share 1.39 1.20 1.06 0.98 0.875
Cash flow from operations 1,899 1,812 3,164 1,736 1,936
Price range of common stock
High 114.40 92.30 78.55 70.28 70.60
Low 78.58 67.21 50.16 38.24 51.50
At May 31,
Cash and equivalents $ 2,317 $ 1,955 $ 3,079 $ 2,291 $ 2,134
Short-term investments 1,440 2,583 2,067 1,164 642
Inventories 3,350 2,715 2,041 2,357 2,438
Working capital 7,666 7,339 7,595 6,457 5,518
Total assets 15,465 14,998 14,419 13,250 12,443
Long-term debt 228 276 446 437 441
Redeemable Preferred Stock 0.3 0.3 0.3 0.3 0.3
Shareholders’ equity 10,381 9,843 9,754 8,693 7,825
Year-end stock price 108.18 84.45 72.38 57.05 68.37
Market capitalization 49,546 39,523 35,032 27,698 33,577
Financial Ratios:
Return on equity 22.0% 21.8% 20.7% 18.0% 25.4%
Return on assets 14.6% 14.5% 13.8% 11.6% 16.3%
Inventory turns 4.5 4.8 4.6 4.4 4.5
Current ratio at May 31 3.0 2.9 3.3 3.0 2.7
Price/Earnings ratio at May 31 22.9 19.2 18.8 18.8 18.3
Selected Quarterly Financial Data
(Unaudited)
(Dollars in millions, except per share data)
1st Quarter 2nd Quarter 3rd Quarter 4th Quarter
2012 2011 2012 2011 2012 2011 2012 2011
Revenues $ 6,081 $ 5,175 $ 5,731 $ 4,842 $ 5,846 $ 5,079 $ 6,470 $ 5,766
Gross profit 2,693 2,434 2,450 2,193 2,561 2,327 2,767 2,554
Gross margin % 44.3% 47.0% 42.7% 45.3% 43.8% 45.8% 42.8% 44.3%
Net income 645 559 469 457 560 523 549 594
Basic earnings per common share 1.39 1.17 1.02 0.96 1.22 1.10 1.20 1.27
Diluted earnings per common share 1.36 1.14 1.00 0.94 1.20 1.08 1.17 1.24
Weighted average common shares
outstanding 465.0 479.6 459.2 477.9 457.5 475.3 458.1 469.3
Diluted weighted average common
shares outstanding 474.3 488.6 468.5 487.6 467.3 485.5 468.1 478.7
Cash dividends declared per common
share 0.31 0.27 0.36 0.31 0.36 0.31 0.36 0.31
Price range of common stock
High 93.66 74.94 96.75 86.53 107.92 92.30 114.40 89.88
Low 78.58 67.21 82.50 72.13 93.38 81.46 104.34 75.45
NIKE, INC. Š2012 Form 10-K 17