National Grid 2013 Annual Report Download - page 47
Download and view the complete annual report
Please find page 47 of the 2013 National Grid annual report below. You can navigate through the pages in the report by either clicking on the pages listed below, or by using the keyword search tool below to find specific information within the annual report.-
 1
1 -
2
-
3
-
4
-
5
-
6
-
7
-
8
-
9
-
10
-
11
-
12
-
13
-
14
-
15
-
16
-
17
-
18
-
19
-
20
-
21
-
22
-
23
-
24
-
25
-
26
-
27
-
28
-
29
-
30
-
31
-
32
-
33
-
34
-
35
-
36
-
 37
37 -
 38
38 -
 39
39 -
 40
40 -
 41
41 -
 42
42 -
 43
43 -
 44
44 -
 45
45 -
 46
46 -
 47
47 -
 48
48 -
 49
49 -
 50
50 -
 51
51 -
 52
52 -
 53
53 -
 54
54 -
 55
55 -
 56
56 -
 57
57 -
58
-
59
-
60
-
61
-
62
-
63
-
64
-
65
-
66
-
67
-
68
 |
 |

46
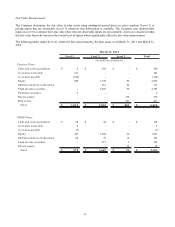
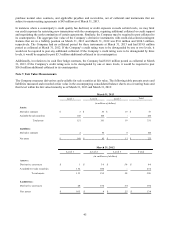
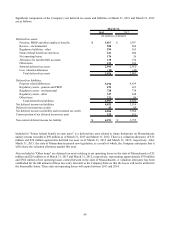
The following is a description of the inputs to and valuation techniques used to measure the fair values above:
Derivatives
The Company’ s Level 1 fair value derivative instruments primarily consist of quoted prices (unadjusted) in active
markets for identical assets or liabilities that a company has the ability to access as of the reporting date. Derivative
assets and liabilities utilizing Level 1 inputs include active exchange-based derivatives (e.g. natural gas futures traded on
NYMEX).
The Company’ s Level 2 fair value derivative instruments primarily consist of over-the-counter (“OTC”) swaps and
forward physical gas deals where market data for pricing inputs is observable. Level 2 pricing inputs are obtained from
the NYMEX and Intercontinental Exchange (“ICE”), except cases in which ICE publishes seasonal averages or there
were no transactions within the last seven days. Level 2 derivative instruments may utilize discounting based on quoted
interest rate curves that may include a liquidity reserve calculated based on bid/ask spread. Substantially all of these
price curves are observable in the marketplace throughout at least 95% of the remaining contractual quantity, or they
could be constructed from market observable curves with correlation coefficients of 0.95 or higher.
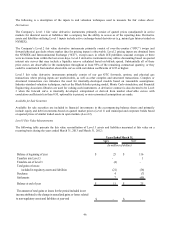
Level 3 fair value derivative instruments primarily consist of our gas OTC forwards, options, and physical gas
transactions where pricing inputs are unobservable, as well as other complex and structured transactions. Complex or
structured transactions can introduce the need for internally-developed models based on reasonable assumptions.
Industry-standard valuation techniques, such as the Black-Scholes pricing model, Monte Carlo simulation, and Financial
Engineering Associates libraries are used for valuing such instruments. A derivative contract is also deemed to be Level
3 when the forward curve is internally developed, extrapolated or derived from market observable curves with
correlation coefficients less than 0.95, optionality is present, or non-economical assumptions are made.
Available for Sale Securities
Available for sale securities are included in financial investments in the accompanying balance sheets and primarily
include equity and debt investments based on quoted market prices (Level 1) and municipal and corporate bonds based
on quoted prices of similar traded assets in open markets (Level 2).
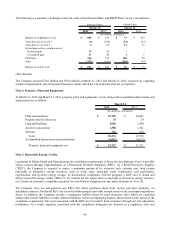
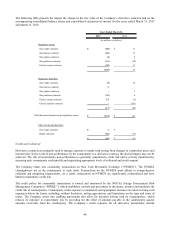
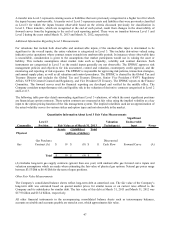
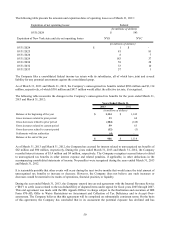
Level 3 Fair Value Measurements
The following table presents the fair value reconciliation of Level 3 assets and liabilities measured at fair value on a
recurring basis during the years ended March 31, 2013 and March 31, 2012:
2013 2012
Balance at beginning of year 25$ 116$
Transfers into Level 3 - 1
Transfers out of Level 3 (4) -
Total gains or losses:
included in regulatory assets and liabilities (21) (36)
Purchases 4 (7)
Settlements 7 (49)
Balance at end of year 11$ 25$
The amount of total gains or losses for the period included in net
income attributed to the change in unrealized gains or losses related
to non-regulatory assets and liabilities at year-end -$ -$
Years Ended March 31,
(in millions of dollars)