National Grid 2013 Annual Report Download - page 36
Download and view the complete annual report
Please find page 36 of the 2013 National Grid annual report below. You can navigate through the pages in the report by either clicking on the pages listed below, or by using the keyword search tool below to find specific information within the annual report.-
 1
1 -
2
-
3
-
4
-
5
-
6
-
7
-
8
-
9
-
10
-
11
-
12
-
13
-
14
-
15
-
16
-
17
-
18
-
19
-
20
-
21
-
22
-
23
-
24
-
25
-
 26
26 -
 27
27 -
 28
28 -
 29
29 -
 30
30 -
 31
31 -
 32
32 -
 33
33 -
 34
34 -
 35
35 -
 36
36 -
 37
37 -
 38
38 -
 39
39 -
 40
40 -
 41
41 -
 42
42 -
 43
43 -
 44
44 -
 45
45 -
 46
46 -
47
-
48
-
49
-
50
-
51
-
52
-
53
-
54
-
55
-
56
-
57
-
58
-
59
-
60
-
61
-
62
-
63
-
64
-
65
-
66
-
67
-
68
 |
 |

35
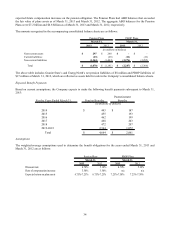
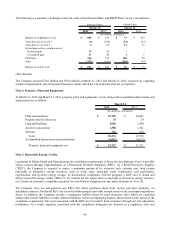
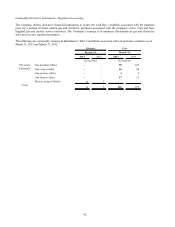
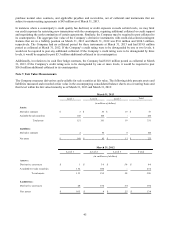
The weighted-average assumptions used to determine the net periodic cost for the years ended March 31, 2013 and
March 31, 2012 are as follows:
2013 2012 2013 2012
Discount rate 5.10% 5.90% 5.10% 5.90%
Rate of compensation increase 3.50% 3.50% n/a n/a
Expected return on plan assets 6.75%-7.25% 7.75% 7.25%-7.50% 7.25%-8.50%
PBOP PlansPension Plans
March 31, March 31,
The Company selects its discount rate assumption based upon rates of return on highly rated corporate bond yields in the
marketplace as of each measurement date. Specifically, the Company uses the Hewitt AA Above Median Curve along
with the expected future cash flows from the Company retirement plans to determine the weighted average discount rate
assumption.
The expected rate of return for various passive asset classes is based both on analysis of historical rates of return and
forward looking analysis of risk premiums and yields. Current market conditions, such as inflation and interest rates, are
evaluated in connection with the setting of the long-term assumptions. A small premium is added for active management
of both equity and fixed income securities. The rates of return for each asset class are then weighted in accordance with
the actual asset allocation, resulting in a long-term return on asset rate for each plan.
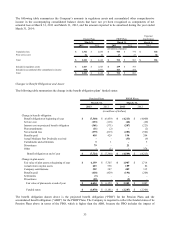
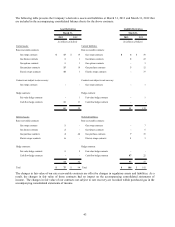
The assumed health care cost trend rates are as follows:
2013 2012
Ultimate rate to which cost trend rate gradually declines 5.00% 5.00%
Year ultimate rate is reached
Pre 65 2019 2018
Post 65 2018 2017
Prescription 2020 2019
PBOP Plans
March 31,
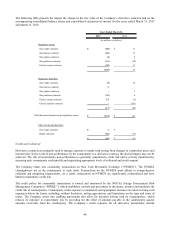
A one-percentage-point change in the assumed health care cost trend rate would have the following effects:
One-Percentage-Point Increase /(Decrease)
Effect on postretirement obligations as of March 31, 2013 688$ (575)$
Effect on annual combined service and interest cost for 2013 51 (41)
(in millions of dollars)
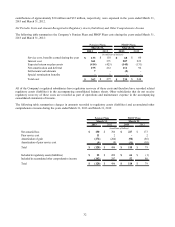
Pension Adjustment Mechanism (“PAM”)
In February 2013, the RIPUC approved implementation of a PAM for Narragansett’ s electric operations. The PAM
reconciles annual pension and PBOP expense with a base amount established in distribution rates through a base-rate
proceeding and allows for recovery of the difference between the rate base amount and an annual expense. As a result of
the implementation of a rate tracker, Narragansett reclassified $145.1 million, pre-tax, of accumulated other
comprehensive income to regulatory assets. This reclassification is presented as an adjustment to accumulated other
comprehensive income in the accompanying consolidated statements of comprehensive income.
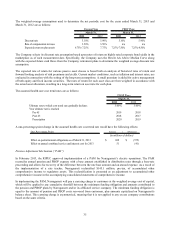
In implementing the PAM, Narragansett will pay a carrying charge to customers at the weighted average cost of capital,
which will be applied to any cumulative shortfall between the minimum funding obligation and amounts contributed to
the pension and PBOP plans by Narragansett and/or its affiliated service company. The minimum funding obligation is
equal to the amount of pension and PBOP costs recovered from customers, plus amounts capitalized on Narragansett's
balance sheet. This carrying charge is asymmetrical, meaning that it is not applied to any excess company contributions
based on the same criteria.