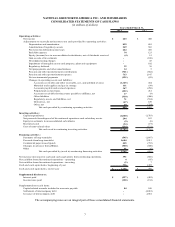
National Grid 2013 Annual Report Download - page 14
Download and view the complete annual report
Please find page 14 of the 2013 National Grid annual report below. You can navigate through the pages in the report by either clicking on the pages listed below, or by using the keyword search tool below to find specific information within the annual report.-
 1
1 -
2
-
3
-
 4
4 -
 5
5 -
 6
6 -
 7
7 -
 8
8 -
 9
9 -
 10
10 -
 11
11 -
 12
12 -
 13
13 -
 14
14 -
 15
15 -
 16
16 -
 17
17 -
 18
18 -
 19
19 -
 20
20 -
 21
21 -
 22
22 -
 23
23 -
 24
24 -
25
-
26
-
27
-
28
-
29
-
30
-
31
-
32
-
33
-
34
-
35
-
36
-
37
-
38
-
39
-
40
-
41
-
42
-
43
-
44
-
45
-
46
-
47
-
48
-
49
-
50
-
51
-
52
-
53
-
54
-
55
-
56
-
57
-
58
-
59
-
60
-
61
-
62
-
63
-
64
-
65
-
66
-
67
-
68
 |
 |

13
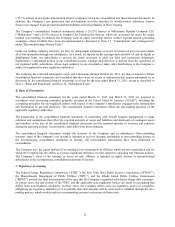
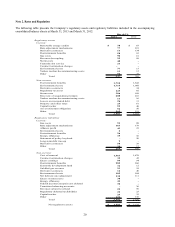
The average composite rates and average service lives for the years ended March 31, 2013 and March 31, 2012 are as
follows:
2013 2012 2013 2012 2013 2012
Composite rates - depreciation 2.1% 2.1% 2.2% 2.2% 2.1% 2.1%
Composite rates - cost of removal 0.5% 0.3% 0.9% 0.9% 0.1% 0.1%
Total composite rates 2.6% 2.4% 3.1% 3.1% 2.2% 2.2%
Average service lives 48 years 48 years 45 years 45 years 47 years 47 years
March 31, March 31, March 31,
Electric Gas Common
Depreciation expense for the Company’ s regulated subsidiaries includes estimated costs to remove property, plant and
equipment, which is recovered through rates charged to customers. At March 31, 2013 and March 31, 2012, the
Company had cumulative costs recovered in excess of costs incurred totaling $1.6 billion and $1.5 billion, respectively.
These amounts are reflected as regulatory liabilities in the accompanying consolidated balance sheets.
In accordance with applicable regulatory accounting guidance, the Company records AFUDC, which represents the
estimated debt and equity costs of capital funds necessary to finance the construction of new regulated facilities. The
equity component of AFUDC is a non-cash amount within the consolidated statements of income. AFUDC is capitalized
as a component of the cost of property, plant and equipment, with an offsetting credit to other income and deductions for
the equity component and other interest expense for the debt component in the accompanying consolidated statements of
income. After construction is completed, the Company’ s regulated entities are permitted to recover these costs through
inclusion in rate base and corresponding depreciation expense.
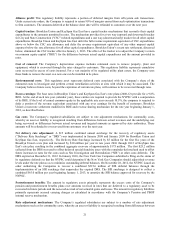
The components of AFUDC capitalized and composite AFUDC rates for the years ended March 31, 2013 and March 31,
2012 are as follows:
2013 2012
Debt 7$ 7$
Equity 21 22
28$ 29$
Composite AFUDC rate 4.1% 6.1%
March 31,
(in millions of dollars)
In addition, approximately $8 million of interest was capitalized for construction of non-regulated projects during fiscal
year 2013.
F. Goodwill and Other Intangible Assets
Goodwill
Goodwill represents the excess of the purchase price of a business over the fair value of the tangible and intangible assets
acquired, net of the fair value of liabilities assumed and the fair value of any non-controlling interest in the acquisition.
The Company tests goodwill for impairment annually on January 31, and whenever events occur or circumstances
change that would more likely than not reduce the fair value of the reporting unit below its carrying amount.
The goodwill impairment analysis is comprised of two steps. In the first step, the estimated fair value of the reporting
unit is compared with its carrying value. If the fair value exceeds the carrying value, goodwill is not impaired and no
further analysis is required. If the carrying value exceeds the fair value, then a second step is performed to determine the
implied fair value of goodwill. If the carrying value of goodwill exceeds its implied fair value, then an impairment
charge equal to the difference is recorded.