National Grid 2013 Annual Report Download - page 33
Download and view the complete annual report
Please find page 33 of the 2013 National Grid annual report below. You can navigate through the pages in the report by either clicking on the pages listed below, or by using the keyword search tool below to find specific information within the annual report.-
 1
1 -
2
-
3
-
4
-
5
-
6
-
7
-
8
-
9
-
10
-
11
-
12
-
13
-
14
-
15
-
16
-
17
-
18
-
19
-
20
-
21
-
22
-
 23
23 -
 24
24 -
 25
25 -
 26
26 -
 27
27 -
 28
28 -
 29
29 -
 30
30 -
 31
31 -
 32
32 -
 33
33 -
 34
34 -
 35
35 -
 36
36 -
 37
37 -
 38
38 -
 39
39 -
 40
40 -
 41
41 -
 42
42 -
 43
43 -
44
-
45
-
46
-
47
-
48
-
49
-
50
-
51
-
52
-
53
-
54
-
55
-
56
-
57
-
58
-
59
-
60
-
61
-
62
-
63
-
64
-
65
-
66
-
67
-
68
 |
 |

32
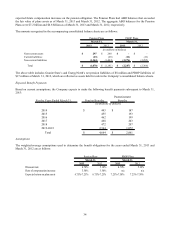
contributions of approximately $30 million and $35 million, respectively, were expensed in the years ended March 31,
2013 and March 31, 2012.
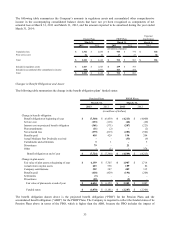
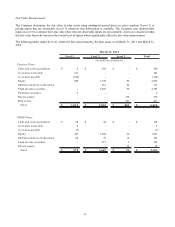
Net Periodic Costs and Amount Recognized in Regulatory Assets (Liabilities) and Other Comprehensive Income
The following table summarizes the Company’ s Pension Plans and PBOP Plans costs during the years ended March 31,
2013 and March 31, 2012:
2013
2012
2013
2012
Service cost, benefits earned during the year 133$ 118$ 68$ 60$
Interest cost 361 371 207 223
Expected return on plan assets (414) (425) (145) (131)
Net amortization and deferral 275 212 111 96
Settlements/curtailments 7-(2) -
Special termination benefits -1--
Total cost 362$ 277$ 239$ 248$
Pension Plans
PBOP Plans
(in millions of dollars)
March 31,
March 31,
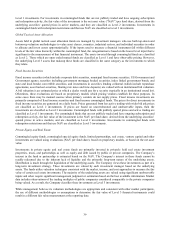
All of the Company’ s regulated subsidiaries have regulatory recovery of these costs and therefore have recorded related
regulatory assets (liabilities) in the accompanying consolidated balance sheets. Other subsidiaries that do not receive
regulatory recovery of these costs are recorded as part of operations and maintenance expense in the accompanying
consolidated statements of income.
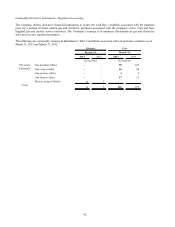
The following table summarizes changes in amounts recorded to regulatory assets (liabilities) and accumulated other
comprehensive income during the years ended March 31, 2013 and March 31, 2012:
2013
2012
2013
2012
Net actuarial loss 150$ 706$ 227$ 173$
Prior service cost 11 2-2
Amortization of gain (272) (204) (98) (86)
Amortization of prior service cost (9) (8) (11) (10)
Total (120)$ 496$ 118$ 79$
Included in regulatory assets (liabilities) 22$ 209$ 66$ (1)$
Included in accumulated other comprehensive income (142) 287 52 80
Total (120)$ 496$ 118$ 79$
Pension Plans
PBOP Plans
(in millions of dollars)
March 31,
March 31,