National Grid 2013 Annual Report Download - page 41
Download and view the complete annual report
Please find page 41 of the 2013 National Grid annual report below. You can navigate through the pages in the report by either clicking on the pages listed below, or by using the keyword search tool below to find specific information within the annual report.-
 1
1 -
2
-
3
-
4
-
5
-
6
-
7
-
8
-
9
-
10
-
11
-
12
-
13
-
14
-
15
-
16
-
17
-
18
-
19
-
20
-
21
-
22
-
23
-
24
-
25
-
26
-
27
-
28
-
29
-
30
-
 31
31 -
 32
32 -
 33
33 -
 34
34 -
 35
35 -
 36
36 -
 37
37 -
 38
38 -
 39
39 -
 40
40 -
 41
41 -
 42
42 -
 43
43 -
 44
44 -
 45
45 -
 46
46 -
 47
47 -
 48
48 -
 49
49 -
 50
50 -
 51
51 -
52
-
53
-
54
-
55
-
56
-
57
-
58
-
59
-
60
-
61
-
62
-
63
-
64
-
65
-
66
-
67
-
68
 |
 |

40
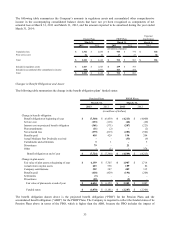
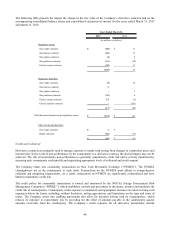
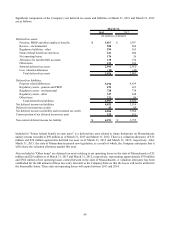
The following is a summary of changes in the fair value of the Pension Plans’ and PBOP Plans’ Level 3 investments:
2013 2012 2013 2012
Balance at beginning of year 804$ 874$ 73$ 103$
Transfers out of Level 3 (4) (338) (24) (55)
Transfers in to Level 3 665 27 11
Actual gain or loss on plan assets
Realized gain 17 29 --
Unrealized gain 37 20 11
Purchases 296 457 188 60
Sales (355) (303) (209) (47)
Balance at end of year 801$ 804$ 56$ 73$
(in millions of dollars)
Pension Plans PBOP Plans
March 31, March 31,
Other Benefits
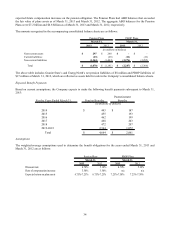
The Company accrued $74.6 million and $58.4 million at March 31, 2013 and March 31, 2012, respectively, regarding
workers compensation, auto and general insurance claims which have been incurred but not yet reported.
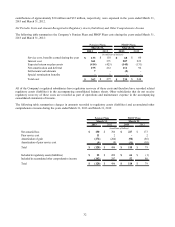
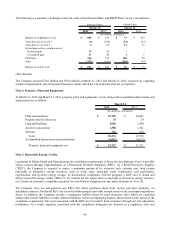
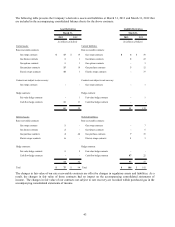
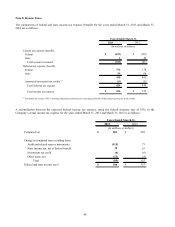
Note 4. Property, Plant and Equipment
At March 31, 2013 and March 31, 2012, property, plant and equipment, at cost, along with accumulated depreciation and
amortization are as follows:
2013
2012
Plant and machinery 25,195$ 24,061$
Property held for future use
24
24
Land and buildings 2,030 1,980
Assets in construction 1,388 1,341
Software 736 552
Total 29,373 27,958
Accumulated depreciation and amortization
(6,851)
(6,637)
Property, plant and equipment, net 22,522$ 21,321$
March 31,
(in millions of dollars)
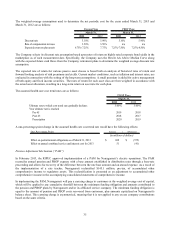
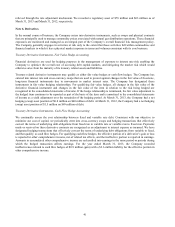
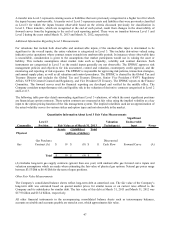
Note 5. Renewable Energy Credits
Legislation in Rhode Island and Massachusetts has established requirements to foster the development of new renewable
energy sources through implementation of a Renewable Portfolio Standard (“RPS”). As a Retail Electricity Supplier
(“RES”), the Company is required to source a minimum portion of its resources each calendar year from certain
renewable or alternative energy resources, such as wind, solar, municipal waste combustion, coal gasification,
cogeneration, and flywheel energy storage. To demonstrate compliance with the program, a RES can (1) obtain and
deliver renewable energy credits (“RECs”); (2) contract for the output from a renewable or alternative energy resource;
or (3) make an alternative compliance payment for each Mwh of obligation not met under alternatives (1) or (2).
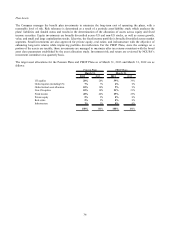
The Company does not self-generate any RECs but rather purchases them from various providers primarily via
standalone contracts. Purchased RECs are recorded within prepaid and other current assets on the accompanying balance
sheets. In addition, the Company records a compliance liability based on retail electricity sales, which are classified
within other current liabilities or other deferred liabilities on the accompanying balance sheets based on the period of the
compliance requirement. Our costs associated with the RPS are recoverable from customers through our rate adjustment
mechanism. As a result, expenses associated with the compliance obligation are deferred as a regulatory asset and