National Grid 2013 Annual Report Download - page 21
Download and view the complete annual report
Please find page 21 of the 2013 National Grid annual report below. You can navigate through the pages in the report by either clicking on the pages listed below, or by using the keyword search tool below to find specific information within the annual report.-
 1
1 -
2
-
3
-
4
-
5
-
6
-
7
-
8
-
9
-
10
-
 11
11 -
 12
12 -
 13
13 -
 14
14 -
 15
15 -
 16
16 -
 17
17 -
 18
18 -
 19
19 -
 20
20 -
 21
21 -
 22
22 -
 23
23 -
 24
24 -
 25
25 -
 26
26 -
 27
27 -
 28
28 -
 29
29 -
 30
30 -
 31
31 -
32
-
33
-
34
-
35
-
36
-
37
-
38
-
39
-
40
-
41
-
42
-
43
-
44
-
45
-
46
-
47
-
48
-
49
-
50
-
51
-
52
-
53
-
54
-
55
-
56
-
57
-
58
-
59
-
60
-
61
-
62
-
63
-
64
-
65
-
66
-
67
-
68
 |
 |

20
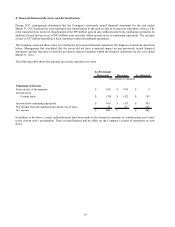
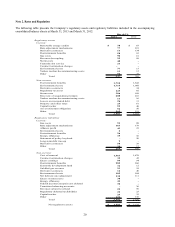
Note 2. Rates and Regulation
The following table presents the Company’ s regulatory assets and regulatory liabilities included in the accompanying
consolidated balance sheets at March 31, 2013 and March 31, 2012:
2013 2012
Regulatory assets
Current:
Renewable energy credits 78$ 63$
Rate adjustment mechanisms 77 221
Derivative contracts 11 134
Postretirement benefits 50 63
Gas costs 90 61
Revenue decoupling 22 89
Storm cos ts 48 -
Transmission service 21 -
Contract termination charges - -
Environmental costs 77 13
Yankee nuclear decommissioning costs 13 12
Other 50 47
Total 537 703
Non-current:
Postretirement benefits 1,710 1,642
Environmental costs 1,714 1,968
Derivative contracts 634
Regulatory tax asset 123 82
Storm cos ts 306 189
Recovery of acquisition premium 208 216
Yankee nuclear decommissioning costs 11 16
Losses on reacquired debt 26 31
Property and other taxes 25 61
Capital tracker 59 46
Asset retirement obligation 54 50
Other 265 119
Total 4,507 4,454
Regulatory liabilities
Current:
Gas costs 91 88
Rate adjustment mechanisms 163 179
Alliance profit 43 23
Environmental costs 4 -
Postretirement benefits 26 -
Energy efficiency 35 36
Statement of policy buyback -20
Long-term debt true-up 9-
Derivative contracts 50 39
Other 38 13
Total 459 398
Non-current:
Cost of removal 1,563 1,478
Contract termination charges 35 45
Excess earnings 95 94
Postretirement benefits 285 260
Economic development fund 36 12
Unbilled gas revenue 23 22
Derivative contracts 12 40
Environmental costs 105 184
Net delivery rate adjustment 130 111
Excess storm reserve 30 -
Energy efficiency 41 -
Federal income tax repair cos t deferral 30 -
Transition balancing accounts -36
Revenue subject to refund 25 50
Regulatory deferred tax liabilities 24 23
Capital tracker 29 35
Other 129 136
Total 2,592 2,526
Net regulatory assets 1,993$ 2,233$
March 31,