National Grid 2013 Annual Report Download - page 38
Download and view the complete annual report
Please find page 38 of the 2013 National Grid annual report below. You can navigate through the pages in the report by either clicking on the pages listed below, or by using the keyword search tool below to find specific information within the annual report.-
 1
1 -
2
-
3
-
4
-
5
-
6
-
7
-
8
-
9
-
10
-
11
-
12
-
13
-
14
-
15
-
16
-
17
-
18
-
19
-
20
-
21
-
22
-
23
-
24
-
25
-
26
-
27
-
 28
28 -
 29
29 -
 30
30 -
 31
31 -
 32
32 -
 33
33 -
 34
34 -
 35
35 -
 36
36 -
 37
37 -
 38
38 -
 39
39 -
 40
40 -
 41
41 -
 42
42 -
 43
43 -
 44
44 -
 45
45 -
 46
46 -
 47
47 -
 48
48 -
49
-
50
-
51
-
52
-
53
-
54
-
55
-
56
-
57
-
58
-
59
-
60
-
61
-
62
-
63
-
64
-
65
-
66
-
67
-
68
 |
 |

37
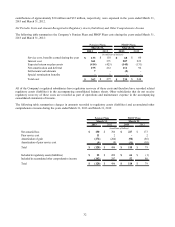
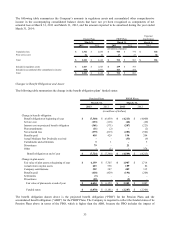
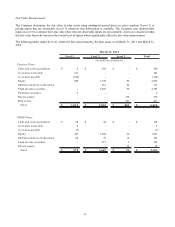
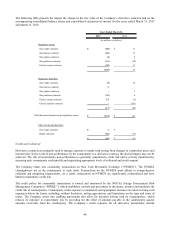
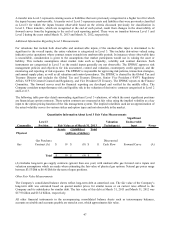
Fair Value Measurements
The Company determines the fair value of plan assets using unadjusted quoted prices in active markets (Level 1) or
pricing inputs that are observable (Level 2) whenever that information is available. The Company uses unobservable
inputs (Level 3) to estimate fair value only when relevant observable inputs are not available. Assets are classified within
this fair value hierarchy based on the lowest level of inputs which significantly affect the fair value measurement.
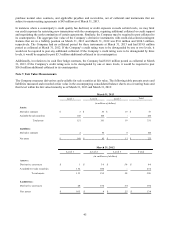
The following tables depict by level, within the fair value hierarchy, the plan assets as of March 31, 2013 and March 31,
2012:
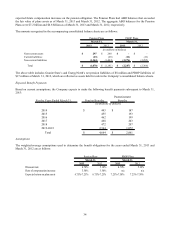
Level 1 Level 2 Level 3 Total
Pension Plans:
Cas h an d cas h eq uiv alen ts 4$ 102$ -$ 106$
A cco unts receivable 141 - - 141
A cco unts payab le (124) - - (124)
Equity 988 1,778 56 2,822
Glo b al tactical ass et allocation - 261 52 313
Fixed income s ecu rities - 2,697 56 2,753
Preferred s ecu rities 6 - - 6
Private equity - - 376 376
Real es tate - - 261 261
Total 1,0 1 5$ 4,83 8$ 801$ 6,65 4$
PBOP Plans:
Cas h an d cas h eq uiv alen ts 94$ 42$ -$ 136$
A cco unts receivable 8 - - 8
A cco unts payab le (7) - - (7)
Equity 419 1,030 22 1,471
Glo b al tactical ass et allocation 64 79 18 161
Fixed income s ecu rities - 517 1 518
Private equity - - 15 15
Total 57 8$ 1,668$ 56$ 2,302$
March 31, 20 13
(in millions of dollars)