National Grid 2013 Annual Report Download - page 37
Download and view the complete annual report
Please find page 37 of the 2013 National Grid annual report below. You can navigate through the pages in the report by either clicking on the pages listed below, or by using the keyword search tool below to find specific information within the annual report.-
 1
1 -
2
-
3
-
4
-
5
-
6
-
7
-
8
-
9
-
10
-
11
-
12
-
13
-
14
-
15
-
16
-
17
-
18
-
19
-
20
-
21
-
22
-
23
-
24
-
25
-
26
-
 27
27 -
 28
28 -
 29
29 -
 30
30 -
 31
31 -
 32
32 -
 33
33 -
 34
34 -
 35
35 -
 36
36 -
 37
37 -
 38
38 -
 39
39 -
 40
40 -
 41
41 -
 42
42 -
 43
43 -
 44
44 -
 45
45 -
 46
46 -
 47
47 -
48
-
49
-
50
-
51
-
52
-
53
-
54
-
55
-
56
-
57
-
58
-
59
-
60
-
61
-
62
-
63
-
64
-
65
-
66
-
67
-
68
 |
 |

36
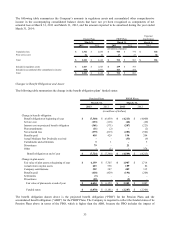
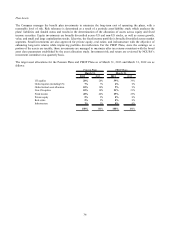
Plan Assets
The Company manages the benefit plan investments to minimize the long-term cost of operating the plans, with a
reasonable level of risk. Risk tolerance is determined as a result of a periodic asset/liability study which analyzes the
plans’ liabilities and funded status and results in the determination of the allocation of assets across equity and fixed
income securities. Equity investments are broadly diversified across US and non-US stocks, as well as across growth,
value, and small and large capitalization stocks. Likewise, the fixed income portfolio is broadly diversified across market
segments. Small investments are also approved for private equity, real estate, and infrastructure with the objective of
enhancing long-term returns while improving portfolio diversification. For the PBOP Plans, since the earnings on a
portion of the assets are taxable, those investments are managed to maximize after tax returns consistent with the broad
asset class parameters established by the asset allocation study. Investment risk and return are reviewed by NGUSA’ s
investment committee on a quarterly basis.
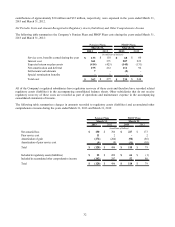
The target asset allocations for the Pension Plans and PBOP Plans as of March 31, 2013 and March 31, 2012 are as
follows:
2013 2012 2013 2012
US equities 20% 20% 39% 39%
Global equities (including US) 7% 7% 6% 6%
Global tactical asset allocation 10% 10% 9% 9%
Non-US equities 10% 10% 21% 21%
Fixed income 40% 40% 25% 25%
Private equity 5% 5% 0% 0%
Real estate 5% 5% 0% 0%
Infrastructure 3% 3% 0% 0%
100% 100% 100% 100%
PBOP PlansPension Plans
March 31, March 31,