Lumber Liquidators 2010 Annual Report Download - page 58
Download and view the complete annual report
Please find page 58 of the 2010 Lumber Liquidators annual report below. You can navigate through the pages in the report by either clicking on the pages listed below, or by using the keyword search tool below to find specific information within the annual report.-
 1
1 -
2
-
3
-
4
-
5
-
6
-
7
-
8
-
9
-
10
-
11
-
12
-
13
-
14
-
15
-
16
-
17
-
18
-
19
-
20
-
21
-
22
-
23
-
24
-
25
-
26
-
27
-
28
-
29
-
30
-
31
-
32
-
33
-
34
-
35
-
36
-
37
-
38
-
39
-
40
-
41
-
42
-
43
-
44
-
45
-
46
-
47
-
 48
48 -
 49
49 -
 50
50 -
 51
51 -
 52
52 -
 53
53 -
 54
54 -
 55
55 -
 56
56 -
 57
57 -
 58
58 -
 59
59 -
 60
60 -
 61
61 -
 62
62 -
 63
63 -
 64
64 -
 65
65 -
 66
66 -
 67
67 -
 68
68 -
69
-
70
-
71
-
72
 |
 |

Lumber Liquidators Holdings, Inc.
Notes to Consolidated Financial Statements—(Continued)
(amounts in thousands, except share data and per share amounts)
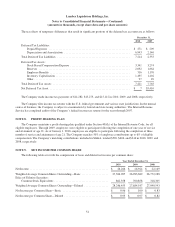
The fair value of each stock option award is estimated by management on the date of the grant using the Black-Scholes-
Merton option pricing model. The weighted average fair value of options granted during 2010, 2009 and 2008 was $11.44,
$5.78, and $4.99, respectively.
The following are the ranges of assumptions for the periods noted:
Year Ended
December 31,
2010 2009 2008
Expected dividend rate ........................................ Nil Nil Nil
Expected stock price volatility .................................. 45% 39-45% 39%
Risk-free interest rate ......................................... 1.9-3.2% 2.8-3.6% 3.2-3.7%
Expected term of options ...................................... 3.5-7.5 years 7.5 years 7.5 years
The expected stock price volatility range is based on the historical volatilities of companies included in a peer group that
was selected by management whose shares or options are publicly available. The volatilities are estimated for a period of
time equal to the expected life of the related option. The risk-free interest rate is based on the implied yield of U.S. Treasury
zero-coupon issues with an equivalent remaining term. The expected term of the options represents the estimated period of
time until exercise and is determined by considering the contractual terms, vesting schedule and expectations of future
employee behavior.
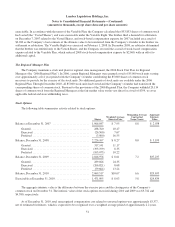
Restricted Stock Awards
The following table summarizes activity related to restricted stock awards:
Shares
Weighted
Average Grant
Date Fair Value
Nonvested, December 31, 2007 .................................... 81,300 $ 8.95
Granted .............................................. 97,092 13.49
Released .............................................. (34,184) 12.46
Forfeited .............................................. (11,435) 9.27
Nonvested, December 31, 2008 .................................... 132,773 $11.33
Granted .............................................. 92,533 13.70
Released .............................................. (58,063) 13.33
Forfeited .............................................. (22,013) 10.06
Nonvested, December 31, 2009 .................................... 145,230 $12.19
Granted .............................................. 67,811 24.69
Released .............................................. (48,245) 24.63
Forfeited .............................................. (22,715) 14.26
Nonvested, December 31, 2010 .................................... 142,081 $13.60
The fair value of restricted stock awards released during the years ended December 31, 2010, 2009, and 2008 was
$1,188, $978, and $426, respectively. As of December 31, 2010, total unrecognized compensation cost related to unvested
restricted stock awards was approximately $665, net of estimated forfeitures, which is expected to be recognized over a
weighted average period of approximately 1.9 years.
52