Lumber Liquidators 2010 Annual Report Download - page 41
Download and view the complete annual report
Please find page 41 of the 2010 Lumber Liquidators annual report below. You can navigate through the pages in the report by either clicking on the pages listed below, or by using the keyword search tool below to find specific information within the annual report.-
 1
1 -
2
-
3
-
4
-
5
-
6
-
7
-
8
-
9
-
10
-
11
-
12
-
13
-
14
-
15
-
16
-
17
-
18
-
19
-
20
-
21
-
22
-
23
-
24
-
25
-
26
-
27
-
28
-
29
-
30
-
 31
31 -
 32
32 -
 33
33 -
 34
34 -
 35
35 -
 36
36 -
 37
37 -
 38
38 -
 39
39 -
 40
40 -
 41
41 -
 42
42 -
 43
43 -
 44
44 -
 45
45 -
 46
46 -
 47
47 -
 48
48 -
 49
49 -
 50
50 -
 51
51 -
52
-
53
-
54
-
55
-
56
-
57
-
58
-
59
-
60
-
61
-
62
-
63
-
64
-
65
-
66
-
67
-
68
-
69
-
70
-
71
-
72
 |
 |
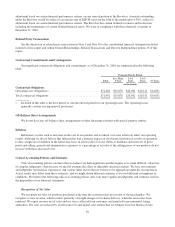
$25.0 million of availability under our revolving credit facility. We expect to use this liquidity for general corporate
purposes, including providing additional long-term capital to support the growth of our business (primarily through opening
new stores) and maintaining our existing stores. We believe that our cash flow from operations, together with our existing
liquidity sources, will be sufficient to fund our operations and anticipated capital expenditures over at least the next 24
months.
In 2011, we expect capital expenditures to total between $16 million and $18 million. In addition to general capital
requirements, we intend to:
• open between 40 and 50 new store locations;
• continue to invest in our integrated technology solution;
• continue to remodel existing store showrooms;
• invest in our finishing line; and
• continue to enhance the online customer experience through our website.
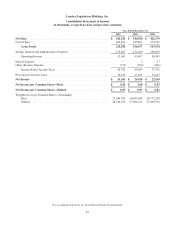
Cash and Cash Equivalents
In 2010, cash and cash equivalents decreased $0.8 million to $34.8 million. The decrease in cash and cash equivalents
was primarily due to the use of $20.5 million in capital expenditures, including software and hardware related to our
integrated technology solution, partially offset by $17.0 million in cash provided by operating activities and $2.7 million of
proceeds received from stock option exercises. In 2009, cash and cash equivalents increased $0.5 million to $35.7 million, as
$7.8 million of cash provided by operating activities and $4.1 million of proceeds received from stock option exercises, were
partially offset by the use of $11.4 million to purchase property and equipment. During 2008, cash and cash equivalents
increased $2.0 million to $35.1 million, as operating activities provided $9.4 million of cash, partially offset by the use of
$6.6 million to purchase property and equipment and $0.8 million to purchase the phone number 1-800-HARDWOOD and
related internet domain names.
Cash Flows
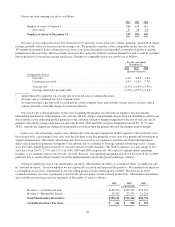
Operating Activities. Net cash provided by operating activities was $17.0 million for 2010, $7.8 million for 2009, and
$9.4 million for 2008. The $9.2 million increase comparing 2010 to 2009 is due primarily to a lower build in merchandise
inventories net of the change in accounts payable, the timing of certain tax items, and an increase in customer deposits
outstanding, partially offset by net changes in certain other working capital items, including prepaid expenses. The $1.6
million decrease comparing 2009 to 2008 is due primarily to a larger build in inventory net of accounts payable, partially
offset by more profitable operations.
Investing Activities. Net cash used in investing activities was $20.5 million for 2010, $11.4 million for 2009, and $7.4
million for 2008. Net cash used in investing activities included capital expenditures related to our integrated technology
solution of $11.3 million in 2010 and $3.9 million in 2009. In addition, net cash used in investing activities in each year
included capital purchases of store fixtures, equipment and leasehold improvements for the new stores and major remodeling
of existing stores, investment in certain equipment including our finishing line and forklifts, routine capital purchases of
computer hardware and software, and certain leasehold improvements in our Corporate Headquarters.
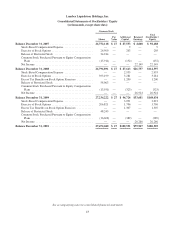
Financing Activities. Net cash provided by financing activities was $2.7 million and $4.2 million in 2010 and 2009,
respectively, primarily due to equity activity, including the exercise of stock options. In 2008, the first full year following our
November 2007 IPO, financing activities were cash neutral.
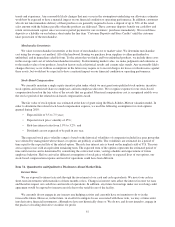
Revolving Credit Agreement
A revolving credit agreement (the “Revolver”) providing for borrowings up to $25.0 million is available to us through
expiration on August 10, 2012. During 2010 and 2009, we did not borrow against the Revolver and at December 31, 2010
and 2009, there were no outstanding commitments under letters of credit. The Revolver is primarily available to fund
inventory purchases, including the support of up to $5.0 million for letters of credit, and for general operations. The Revolver
is secured by our inventory, has no mandated payment provisions and we pay a fee of 0.125% per annum, subject to
35