Lumber Liquidators 2010 Annual Report Download - page 37
Download and view the complete annual report
Please find page 37 of the 2010 Lumber Liquidators annual report below. You can navigate through the pages in the report by either clicking on the pages listed below, or by using the keyword search tool below to find specific information within the annual report.-
 1
1 -
2
-
3
-
4
-
5
-
6
-
7
-
8
-
9
-
10
-
11
-
12
-
13
-
14
-
15
-
16
-
17
-
18
-
19
-
20
-
21
-
22
-
23
-
24
-
25
-
26
-
 27
27 -
 28
28 -
 29
29 -
 30
30 -
 31
31 -
 32
32 -
 33
33 -
 34
34 -
 35
35 -
 36
36 -
 37
37 -
 38
38 -
 39
39 -
 40
40 -
 41
41 -
 42
42 -
 43
43 -
 44
44 -
 45
45 -
 46
46 -
 47
47 -
48
-
49
-
50
-
51
-
52
-
53
-
54
-
55
-
56
-
57
-
58
-
59
-
60
-
61
-
62
-
63
-
64
-
65
-
66
-
67
-
68
-
69
-
70
-
71
-
72
 |
 |

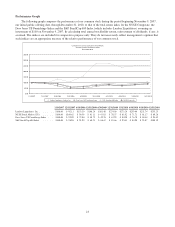
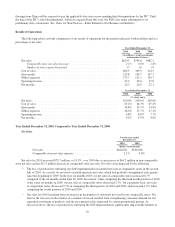
were received directly at the store, up from 16.4% in 2009. In the second half of 2010, these direct shipments
represented 23.8% of our unit purchases, up from 14.7% in the second half of 2009.
• Our efforts to expand and regionalize our assortment of Bellawood products resulted in 2010 per unit finishing
costs generally higher than those in 2009, primarily due to greater demand for products which are less efficient to
finish.
In aggregate, sales mix shifts were neutral to gross margin, including:
• Gross margin benefited from our continued efforts to broaden the assortment and strengthen the in-stock positions
of moldings and accessories, as well as laminates and certain engineered hardwoods, particularly the premium
products. These product lines generally carry a higher than average gross margin.
• Gross margin was adversely impacted by a strengthening in consumer demand for certain hardwoods, particularly
those at the entry level, which generally carry higher than average retail price points, but lower than average gross
margins.
• Liquidation deals, used as promotional opportunities to generate incremental traffic, have generally yielded lower
gross margins in 2010 than in 2009, and in each year, those gross margins have been lower than average.
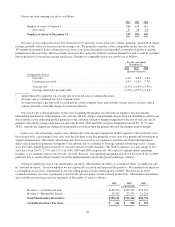
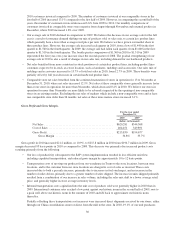
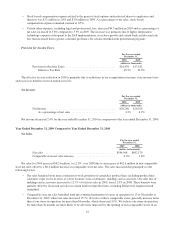
Operating Income and Operating Margin.
For the year ended
December 31,
2010 2009
(dollars in thousands)
Gross Profit .............................................. $215,830 $194,677
SG&A Expenses .......................................... 173,667 151,070
Operating Income ......................................... $ 42,163 $ 43,607
Operating Margin ..................................... 6.8% 8.0%
Operating income for 2010 decreased $1.4 million, or 3.3%, over 2009 as the $21.2 million increase in gross profit was
offset by a $22.6 million increase in SG&A expenses. The increase in SG&A expenses was principally due to the following
factors:
• Approximately $0.9 million in incremental expenses related to the SAP system implementation.
• Salaries, commissions and benefits increased $10.7 million in 2010 from the prior year, and as a percentage of net
sales, were 11.2% of net sales for 2010 and 10.8% of net sales for 2009. These increases were primarily due to:
OGrowth in our store base, a greater commitment to in-store management and staffing at certain smaller stores,
as well as an expanded store training program;
OLabor costs for our distribution, warehousing and finishing functions due primarily to increased sales volume
and higher in-stock positions of merchandise inventories; and
OExpanded corporate store-support infrastructure, partially offset by a significant reduction in accrued
executive bonuses.
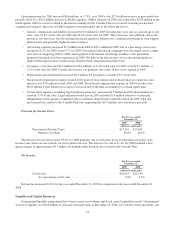
• Advertising expenses increased $2.5 million from 2009 to $49.8 million in 2010, but as a percentage of net sales,
declined to 8.0% for 2010, from 8.7% for 2009. National advertising campaigns were leveraged across a larger
store base in comparing 2010 to 2009, and in general, both national advertising and direct sales generation
programs benefited from lower unit prices. We continue to believe the overall effectiveness of our advertising
spend improved through increases in direct mail, television and internet search.
• Occupancy costs increased to $22.2 million, or 3.6% of net sales for 2010, from $18.4 million, or 3.4% of net sales
for 2009. The increase was primarily due to our store base expansion, partially offset by leverage at comparable
stores.
• Depreciation and amortization increased $0.9 million but remained a constant 0.9% of net sales. Depreciation on
the new SAP system began in August 2010.
31