Lumber Liquidators 2010 Annual Report Download - page 38
Download and view the complete annual report
Please find page 38 of the 2010 Lumber Liquidators annual report below. You can navigate through the pages in the report by either clicking on the pages listed below, or by using the keyword search tool below to find specific information within the annual report.-
 1
1 -
2
-
3
-
4
-
5
-
6
-
7
-
8
-
9
-
10
-
11
-
12
-
13
-
14
-
15
-
16
-
17
-
18
-
19
-
20
-
21
-
22
-
23
-
24
-
25
-
26
-
27
-
 28
28 -
 29
29 -
 30
30 -
 31
31 -
 32
32 -
 33
33 -
 34
34 -
 35
35 -
 36
36 -
 37
37 -
 38
38 -
 39
39 -
 40
40 -
 41
41 -
 42
42 -
 43
43 -
 44
44 -
 45
45 -
 46
46 -
 47
47 -
 48
48 -
49
-
50
-
51
-
52
-
53
-
54
-
55
-
56
-
57
-
58
-
59
-
60
-
61
-
62
-
63
-
64
-
65
-
66
-
67
-
68
-
69
-
70
-
71
-
72
 |
 |

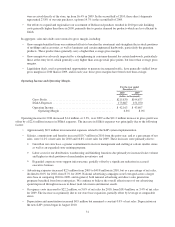
• Stock-based compensation expense related to the grant of stock options and restricted shares to employees and
directors was $3.1 million in 2010 and $3.0 million in 2009. As a percentage of net sales, stock-based
compensation expense remained constant at 0.5%.
• Certain other expenses, including legal and professional fees, increased $4.5 million in 2010 and as a percentage of
net sales increased to 3.8% compared to 3.5% in 2009. The increase was primarily due to higher information
technology expenses subsequent to the SAP implementation, store-base growth and certain bankcard discount rate
fees that increased due to greater consumer preference for certain extended-term promotional programs.
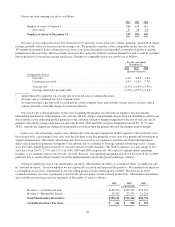
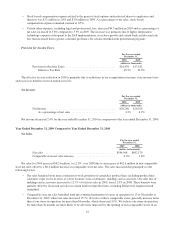
Provision for Income Taxes.
For the year ended
December 31,
2010 2009
(dollars in thousands)
Provision for Income Taxes ................................... $16,476 $17,181
Effective Tax Rate ...................................... 38.5% 39.0%
The effective tax rate reduction in 2010 is primarily due to reductions in tax-exempt interest income, state income taxes
and excess tax benefits on stock option exercises.
Net Income.
For the year ended
December 31,
2010 2009
(dollars in thousands)
Net Income ................................................ $26,266 $26,924
As a percentage of net sales ............................... 4.2% 4.9%
Net income decreased 2.4% for the year ended December 31, 2010 in comparison to the year ended December 31, 2009.
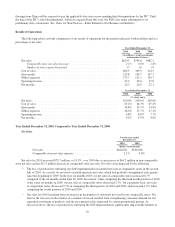
Year Ended December 31, 2009 Compared to Year Ended December 31, 2008
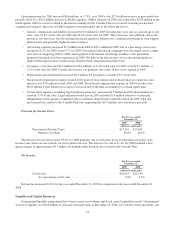
Net Sales.
For the year ended
December 31,
2009 2008
(dollars in thousands)
Net sales ................................................ $544,568 $482,179
Comparable store net sales increase ........................... 0.0% 1.6%
Net sales for 2009 increased $62.4 million, or 12.9%, over 2008 due to an increase of $62.6 million in non-comparable
store net sales offset by a $0.2 million decrease in comparable store net sales. Net sales increased due principally to the
following factors:
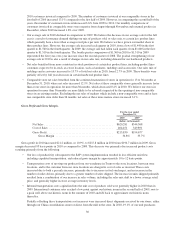
• Net sales benefited from more consistent in-stock positions of certain key product lines, including product lines
customers expect to be in-stock at a store location, such as laminates, moldings and accessories. Our sales mix of
moldings and accessories increased to 12.7% of total net sales in 2009, from 11.0% in 2008. These benefits were
partially offset by decreased net sales in certain hardwood product lines, including Bellawood, engineered and
unfinished.
• Comparable store net sales benefited from the continued maturation of stores in operation for 13 to 36 months at
December 31, 2009, where net sales increased 15.7%. Net sales at these comparable stores generally increase faster
than at our stores in operation for more than 36 months, which decreased 3.9%. We believe our stores in operation
for more than 36 months are more likely to be adversely impacted by the opening of non-comparable stores in an
32