Lumber Liquidators 2010 Annual Report Download - page 30
Download and view the complete annual report
Please find page 30 of the 2010 Lumber Liquidators annual report below. You can navigate through the pages in the report by either clicking on the pages listed below, or by using the keyword search tool below to find specific information within the annual report.-
 1
1 -
2
-
3
-
4
-
5
-
6
-
7
-
8
-
9
-
10
-
11
-
12
-
13
-
14
-
15
-
16
-
17
-
18
-
19
-
 20
20 -
 21
21 -
 22
22 -
 23
23 -
 24
24 -
 25
25 -
 26
26 -
 27
27 -
 28
28 -
 29
29 -
 30
30 -
 31
31 -
 32
32 -
 33
33 -
 34
34 -
 35
35 -
 36
36 -
 37
37 -
 38
38 -
 39
39 -
 40
40 -
41
-
42
-
43
-
44
-
45
-
46
-
47
-
48
-
49
-
50
-
51
-
52
-
53
-
54
-
55
-
56
-
57
-
58
-
59
-
60
-
61
-
62
-
63
-
64
-
65
-
66
-
67
-
68
-
69
-
70
-
71
-
72
 |
 |

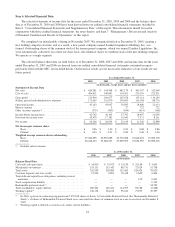
Item 6. Selected Financial Data.
The selected statements of income data for the years ended December 31, 2010, 2009 and 2008 and the balance sheet
data as of December 31, 2010 and 2009 have been derived from our audited consolidated financial statements included in
Item 8. “Consolidated Financial Statements and Supplementary Data” of this report. This information should be read in
conjunction with those audited financial statements, the notes thereto, and Item 7. “Management’s Discussion and Analysis
of Financial Condition and Results of Operations” of this report.
We completed our initial public offering in November 2007. We reorganized effective December 31, 2009, creating a
new holding company structure, and as a result, a new parent company named Lumber Liquidators Holdings, Inc. was
formed. Outstanding shares of the common stock of the former parent company, which was named Lumber Liquidators, Inc.,
were automatically converted, on a share for share basis, into identical shares of common stock of the new holding company.
We operate as a single segment.
The selected balance sheet data set forth below as of December 31, 2008, 2007 and 2006, and income data for the years
ended December 31, 2007 and 2006 are derived from our audited consolidated financial statements contained in reports
previously filed with the SEC, not included herein. Our historical results are not necessarily indicative of our results for any
future period.
Year Ended December 31,
2010 2009 2008 2007 2006
(in thousands, except share and per share amounts)
Statement of Income Data
Net sales ........................................... $ 620,281 $ 544,568 $ 482,179 $ 405,307 $ 332,060
Cost of sales ........................................ 404,451 349,891 314,501 270,193 221,931
Gross profit ......................................... 215,830 194,677 167,678 135,114 110,129
Selling, general and administrative expenses ............... 173,667 151,070 130,693 116,308 88,716
Operating income .................................... 42,163 43,607 36,985 18,806 21,413
Interest expense ..................................... — 2 27 722 722
Other (income) expense(1) .............................. (579) (500) (834) (413) (368)
Income before income taxes ............................ 42,742 44,105 37,792 18,497 21,059
Provision for income taxes ............................. 16,476 17,181 15,643 7,171 8,161
Net income ......................................... $ 26,266 $ 26,924 $ 22,149 $ 11,326 $ 12,898
Net income per common share:
Basic .......................................... $ 0.96 $ 1.00 $ 0.83 $ 0.68 $ 0.86
Diluted ........................................ $ 0.93 $ 0.97 $ 0.82 $ 0.48 $ 0.56
Weighted average common shares outstanding:
Basic .......................................... 27,384,095 26,983,689 26,772,288 16,646,674 15,000,100
Diluted ........................................ 28,246,453 27,684,547 27,090,593 23,634,995 22,989,403
(1) Includes interest income.
As of December 31,
2010 2009 2008 2007 2006
(in thousands)
Balance Sheet Data
Cash and cash equivalents ................................ $ 34,830 $ 35,675 $ 35,139 $ 33,168 $ 3,965
Merchandise inventories ................................. 155,131 133,342 88,731 72,024 51,758
Total assets ............................................ 242,290 205,880 152,405 128,424 78,020
Customer deposits and store credits ........................ 12,039 9,805 10,418 9,609 6,804
Total debt and capital lease obligations, including current
maturities ........................................... — — — 122 9,603
Stock compensation liability .............................. — — — — 9,132
Redeemable preferred stock(1) ............................. — — — — 34,795
Total stockholders’ equity (deficit) ......................... 180,505 148,434 114,397 92,188 (5,468)
Working capital(2) ...................................... 146,118 124,100 96,245 77,875 30,297
(1) In 2004, a private investment group purchased 7,952,018 shares of Series A Convertible Preferred Stock (the “Redeemable Preferred
Stock”); all shares of Redeemable Preferred Stock were converted into shares of common stock on a one-to-one basis on November 8,
2007.
(2) Working capital is defined as current assets minus current liabilities.
24