Lumber Liquidators 2010 Annual Report Download - page 39
Download and view the complete annual report
Please find page 39 of the 2010 Lumber Liquidators annual report below. You can navigate through the pages in the report by either clicking on the pages listed below, or by using the keyword search tool below to find specific information within the annual report.-
 1
1 -
2
-
3
-
4
-
5
-
6
-
7
-
8
-
9
-
10
-
11
-
12
-
13
-
14
-
15
-
16
-
17
-
18
-
19
-
20
-
21
-
22
-
23
-
24
-
25
-
26
-
27
-
28
-
 29
29 -
 30
30 -
 31
31 -
 32
32 -
 33
33 -
 34
34 -
 35
35 -
 36
36 -
 37
37 -
 38
38 -
 39
39 -
 40
40 -
 41
41 -
 42
42 -
 43
43 -
 44
44 -
 45
45 -
 46
46 -
 47
47 -
 48
48 -
 49
49 -
50
-
51
-
52
-
53
-
54
-
55
-
56
-
57
-
58
-
59
-
60
-
61
-
62
-
63
-
64
-
65
-
66
-
67
-
68
-
69
-
70
-
71
-
72
 |
 |

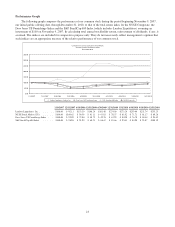
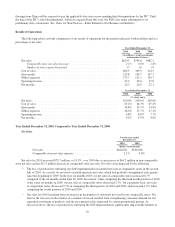
existing market. Excluding the net sales of markets which include a non-comparable store and at least one
comparable store older than 36 months, net sales at these more mature stores increased 0.6%.
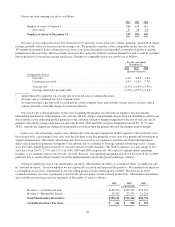
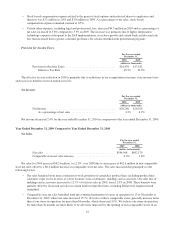
Gross Profit and Gross Margin.
For the year ended
December 31,
2009 2008
(dollars in thousands)
Net Sales ................................................ $544,568 $482,179
Cost of Sales ............................................. 349,891 314,501
Gross Profit .............................................. $194,677 $167,678
Gross Margin ........................................ 35.7% 34.8%
Gross profit in 2009 increased $27.0 million, or 16.1%, to $194.7 million in 2009 from $167.7 million in 2008. Gross
margin improved 90 basis points in 2009 as compared to 2008 primarily due to the following:
• We continued our investment in infrastructure initiatives within key functional areas impacting our product
assortment, product flow and commitment to in-stock positions, including product planning, allocation and
logistics. As a result, we believe this drove certain sales mix changes, shortened the distance the product travels
between the vendor-mill and the final sales floor, and reduced the cost of our products and the related
transportation.
• Our efforts to broaden our assortment of moldings and accessories while remaining committed to an available
in-stock position increased the sales mix of this key product line, which generally carries gross margins higher than
our average.
• In addition to our efforts to drive sales mix increases in certain key product lines and the premium products within
those product lines, we believe the weakness in the macroeconomic environment throughout 2009 also resulted in a
shift away from certain hardwood product lines that generally carry higher than average retail prices per unit sold,
but slightly lower than average gross margins.
• Together with our logistics initiatives to reduce both domestic and international transportation costs, gross margin
in the second half of 2009 benefited from favorable international container rates in comparison to the rates
impacting 2008. We believe lower international container rates in the second half of 2009 in comparison to our
historic average container rates resulted in up to 60 basis points of gross margin benefit in the third and fourth
quarters.
• Our gross margin in 2008 included the net impact of certain special liquidation deals and the retroactive rebate of a
bamboo tariff. In 2008, those special liquidation deals, unique in their unit count, quality and cost, added
approximately 20 basis points to gross margin in 2008. Gross margin for 2008 also benefited from the retroactive
rebate by approximately 20 basis points.
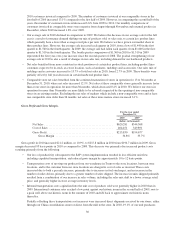
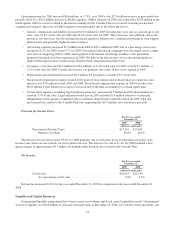
Operating Income and Operating Margin.
For the year ended
December 31,
2009 2008
(dollars in thousands)
Gross Profit .............................................. $194,677 $167,678
SG&A Expenses .......................................... 151,070 130,693
Operating Income ......................................... $ 43,607 $ 36,985
Operating Margin ..................................... 8.0% 7.7%
33