Lumber Liquidators 2010 Annual Report Download - page 40
Download and view the complete annual report
Please find page 40 of the 2010 Lumber Liquidators annual report below. You can navigate through the pages in the report by either clicking on the pages listed below, or by using the keyword search tool below to find specific information within the annual report.-
 1
1 -
2
-
3
-
4
-
5
-
6
-
7
-
8
-
9
-
10
-
11
-
12
-
13
-
14
-
15
-
16
-
17
-
18
-
19
-
20
-
21
-
22
-
23
-
24
-
25
-
26
-
27
-
28
-
29
-
 30
30 -
 31
31 -
 32
32 -
 33
33 -
 34
34 -
 35
35 -
 36
36 -
 37
37 -
 38
38 -
 39
39 -
 40
40 -
 41
41 -
 42
42 -
 43
43 -
 44
44 -
 45
45 -
 46
46 -
 47
47 -
 48
48 -
 49
49 -
 50
50 -
51
-
52
-
53
-
54
-
55
-
56
-
57
-
58
-
59
-
60
-
61
-
62
-
63
-
64
-
65
-
66
-
67
-
68
-
69
-
70
-
71
-
72
 |
 |

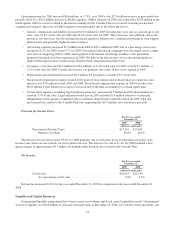
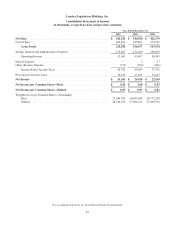
Operating income for 2009 increased $6.6 million, or 17.9%, over 2008 as the $27.0 million increase in gross profit was
partially offset by a $20.4 million increase in SG&A expenses. SG&A expenses in 2008 were reduced by $2.96 million in the
fourth quarter 2008 as a reserve related to the final accounting for the Variable Plan was reversed, lowering stock-based
compensation expense. Increases in SG&A expenses were principally due to the following factors:
• Salaries, commissions and benefits increased $10.3 million for 2009 from the prior year, and as a percentage of net
sales, were 10.8% of net sales for 2009 and 10.1% of net sales for 2008. These increases were primarily due to the
growth in our store base, but also included increased employee benefit costs, continued investment in store support
infrastructure and generally higher incentive bonuses.
• Advertising expenses increased $1.5 million from 2008 to $47.3 million in 2009, but as a percentage of net sales,
declined to 8.7% for 2009, from 9.5% for 2008. Our national advertising campaigns were leveraged across a larger
store base in comparing 2009 to 2008, and in general, both national advertising and direct sales generation
programs benefited from lower unit prices in 2009. We believe the effectiveness of our advertising spend was
improved through increases in direct mail, internet search and promotional television.
• Occupancy costs increased $3.3 million to $18.4 million, or 3.4% of net sales for 2009, from $15.1 million, or
3.1% of net sales for 2008. Overall, the increase was primarily due to the 36 new stores opened in 2009.
• Depreciation and amortization increased $0.4 million but remained a constant 0.9% of net sales.
• Stock-based compensation expense related to the grant of stock options and restricted shares to employees and
directors was $3.0 million in both 2009 and 2008. Stock-based compensation expense in 2008 was reduced to
$0.01 million by the benefit of a reserve reversal related to the final accounting for a certain equity plan.
• Certain other expenses, including legal and professional fees, increased $1.9 million in 2009 and remained at a
constant 3.5% of net sales. Legal and professional fees in 2009 included $1.4 million related to a trademark
infringement action against a competitor that we initiated, litigated and eventually settled. In 2008, legal and
professional fees related to the Variable Plan were approximately $0.7 million, net of insurance proceeds.
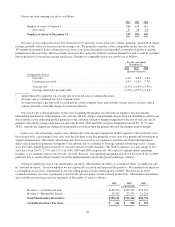
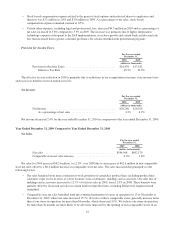
Provision for Income Taxes.
For the year ended
December 31,
2009 2008
(dollars in thousands)
Provision for Income Taxes ................................... $17,181 $15,643
Effective Tax Rate ...................................... 39.0% 41.4%
The effective tax rate decreased to 39.0% for 2009 primarily due to reductions in tax-exempt interest income, state
income taxes and excess tax benefits on stock option exercises. The effective tax rate of 41.4% for 2008 included a first
quarter charge of approximately $0.7 million for nondeductible deferred taxes related to the Variable Plan.
Net Income.
For the year ended
December 31,
2009 2008
(dollars in thousands)
Net Income ................................................ $26,924 $22,149
As a percentage of net sales ............................... 4.9% 4.6%
Net income increased 21.6% for the year ended December 31, 2009 in comparison to the year ended December 31,
2008.
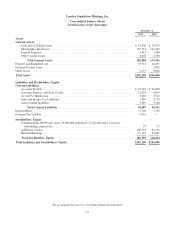
Liquidity and Capital Resources
Our principal liquidity requirements have been to meet our working capital and capital expenditure needs. Our principal
sources of liquidity are $34.8 million of cash and cash equivalents at December 31, 2010, our cash flow from operations, and
34