Lumber Liquidators 2010 Annual Report Download - page 36
Download and view the complete annual report
Please find page 36 of the 2010 Lumber Liquidators annual report below. You can navigate through the pages in the report by either clicking on the pages listed below, or by using the keyword search tool below to find specific information within the annual report.-
 1
1 -
2
-
3
-
4
-
5
-
6
-
7
-
8
-
9
-
10
-
11
-
12
-
13
-
14
-
15
-
16
-
17
-
18
-
19
-
20
-
21
-
22
-
23
-
24
-
25
-
 26
26 -
 27
27 -
 28
28 -
 29
29 -
 30
30 -
 31
31 -
 32
32 -
 33
33 -
 34
34 -
 35
35 -
 36
36 -
 37
37 -
 38
38 -
 39
39 -
 40
40 -
 41
41 -
 42
42 -
 43
43 -
 44
44 -
 45
45 -
 46
46 -
47
-
48
-
49
-
50
-
51
-
52
-
53
-
54
-
55
-
56
-
57
-
58
-
59
-
60
-
61
-
62
-
63
-
64
-
65
-
66
-
67
-
68
-
69
-
70
-
71
-
72
 |
 |

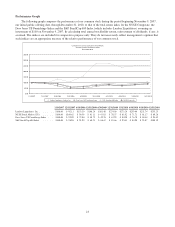
2010 customers invoiced compared to 2009. The number of customers invoiced at our comparable stores in the
first half of 2010 increased 13.1% compared to the first half of 2009. However, in comparing the second half of the
years, the number of customers invoiced decreased 3.6% from 2009 to 2010. Our monthly comparisons of
customers invoiced in comparable stores were negative from August through November and returned positive in
December, where 2010 increased 1.8% over 2009.
• Our average sale in 2010 declined in comparison to 2009. We believe the decrease in our average sale for the full
year is a result of consumer demand shifting our mix of products sold, or sales mix, to certain key product lines
which generally have a lower than average retail price per unit. We believe we have grown our market share in
these product lines. However, the average sale increased each quarter in 2010, from a low of $1,440 in the first
quarter to $1,560 in the fourth quarter. In 2009, the average sale had fallen each quarter, from $1,600 in the first
quarter to $1,510 in the fourth quarter. The fourth quarter comparison of $1,560 in 2010 to $1,510 in 2009
represented the first year-over-year increase since the second quarter of 2008. The gradual strengthening of our
average sale in 2010 is also a result of changes in our sales mix, including demand for our hardwood products.
• Net sales benefited from more consistent in-stock positions of certain key product lines, including product lines
customers expect to be in-stock at a store location, such as laminates, moldings and accessories. Our sales mix of
moldings and accessories increased to 13.7% of total net sales in 2010, from 12.7% in 2009. These benefits were
partially offset by full year decreases in certain hardwood product lines.
• Comparable store net sales benefited from the continued maturation of stores in operation for 13 to 36 months at
December 31, 2010, where net sales increased 12.1%. Net sales at these comparable stores generally increase faster
than at our stores in operation for more than 36 months, which decreased 0.4% in 2010. We believe our stores in
operation for more than 36 months are more likely to be adversely impacted by the opening of non-comparable
stores in an existing market. Excluding the net sales of markets which include a non-comparable store and at least
one comparable store older than 36 months, net sales at these more mature stores increased 3.1%.
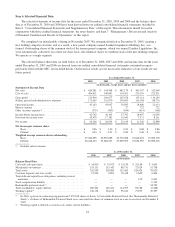
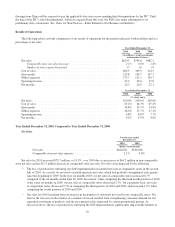
Gross Profit and Gross Margin.
For the year ended
December 31,
2010 2009
(dollars in thousands)
Net Sales ................................................ $620,281 $544,568
Cost of Sales ............................................. 404,451 349,891
Gross Profit .............................................. $215,830 $194,677
Gross Margin ........................................ 34.8% 35.7%
Gross profit in 2010 increased $21.2 million, or 10.9%, to $215.8 million in 2010 from $194.7 million in 2009. Gross
margin decreased 95 basis points in 2010 as compared to 2009. This decrease was primarily due increased product costs
resulting primarily from the following:
• Our loss of productivity subsequent to the SAP system implementation resulted in less efficient unit flow,
including expedited transportation, and reduced gross margin by approximately 10 to 12 basis points.
• Transportation costs of moving our products from our warehouse in Toano to the store locations, between store
locations, and to the customer from our store locations are charged to cost of sales as incurred. These costs
increased due to both a per mile increase, primarily due to increases in fuel surcharges, and an increase in the
number of miles driven, primarily due to a greater number of units shipped. The increase in units shipped primarily
resulted from a combination of our increase in sales volume, including the sales mix shift to a lower average retail
price, and generally higher in-store average inventory levels.
• Inbound transportation costs capitalized into the unit cost of products sold were generally higher in 2010 than in
2009. International container rates reached a low point against our historic norm in the second half of 2009, rose to
a peak well above our historic norm in the summer of 2010 and fell back to approximate our historic norm
thereafter.
Partially offsetting these transportation cost increases were increased direct shipments received by our stores, either
through our China consolidation center or direct from the mill to the store. In 2010, 19.1% of our unit purchases
30