Lumber Liquidators 2010 Annual Report Download - page 32
Download and view the complete annual report
Please find page 32 of the 2010 Lumber Liquidators annual report below. You can navigate through the pages in the report by either clicking on the pages listed below, or by using the keyword search tool below to find specific information within the annual report.-
 1
1 -
2
-
3
-
4
-
5
-
6
-
7
-
8
-
9
-
10
-
11
-
12
-
13
-
14
-
15
-
16
-
17
-
18
-
19
-
20
-
21
-
 22
22 -
 23
23 -
 24
24 -
 25
25 -
 26
26 -
 27
27 -
 28
28 -
 29
29 -
 30
30 -
 31
31 -
 32
32 -
 33
33 -
 34
34 -
 35
35 -
 36
36 -
 37
37 -
 38
38 -
 39
39 -
 40
40 -
 41
41 -
 42
42 -
43
-
44
-
45
-
46
-
47
-
48
-
49
-
50
-
51
-
52
-
53
-
54
-
55
-
56
-
57
-
58
-
59
-
60
-
61
-
62
-
63
-
64
-
65
-
66
-
67
-
68
-
69
-
70
-
71
-
72
 |
 |

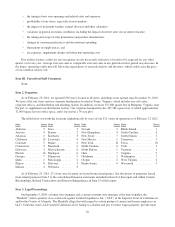
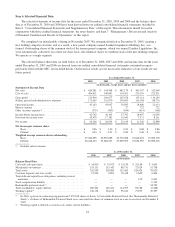
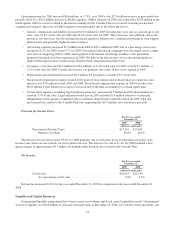
Our recent store opening activity is as follows:
2010 2009 2008
Number of stores at January 1 .......................................... 186 150 116
New stores ..................................................... 37 36 34
Number of stores at December 31 ..................................... 223 186 150
Net sales at our comparable stores have been driven by increases in our total sales volume, primarily measured in square
footage, partially offset by decreases in our average sale. We generally consider a store comparable on the first day of the
13th month of operation. Sales volume increases have come from demand for our expanded assortment of products and the
maturation of our store base. Macroeconomic pressures have generally shifted consumer demand towards certain key product
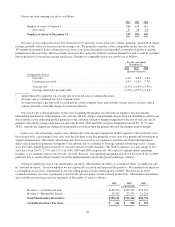
lines which have a lower than average retail price. Changes to comparable prior year results are as follows:
For the year ended
December 31,
2010 2009 2008
increase (decrease)
Comparable Stores:
Net sales ..................................................... 2.1% 0.0% 1.6%
Customers invoiced1............................................ 4.5% 12.4% 5.7%
Average sale2.................................................. (2.4%) (11.0%) (3.8%)
Average retail price per unit sold3.................................. (3.7%) (10.5%) (4.4%)
1Approximated by applying our average sale to total net sales at comparable stores
2Average sale is calculated on a total company basis
3Average retail price per unit sold is calculated on a total company basis and excludes certain service revenue, which
consists primarily of freight charges for in-home delivery
Our cost of sales is driven primarily by the cost of acquiring the products we sell from our suppliers, but also includes
international and domestic transportation costs, customs and duty charges, transportation charges from our distribution center to our
stores and the cost of delivering product purchases to the customer. Our gross margin is impacted by the cost of sales, the mix of
products sold and the average retail price per unit sold. In 2010, 2009 and 2008, our gross margin has been 34.8%, 35.7% and
34.8%, respectively. Significant changes in transportation costs have been the primary driver of the changes in gross margin.
Labor costs and advertising expenses have historically been our most significant SG&A expenses. Our total labor costs
have increased as a percentage of net sales over the last three years due primarily to our store base growth and investment in
support infrastructure. Our annual advertising costs have increased as we continue to promote our brand and implement
direct sales generation programs in support of our growth, but we continue to leverage national advertising across a larger
store base and commit greater resources to our most effective media channels. Our SG&A expenses as a percentage of net
sales have been 28.0%, 27.7% and 27.1% in 2010, 2009 and 2008, respectively. We expect to expand annual operating
margins as we continue to grow our net sales. In 2010, however, our operating margin decreased to 6.8% from 8.0% in 2009,
primarily due to certain adverse impacts from the implementation of our integrated technology solution.
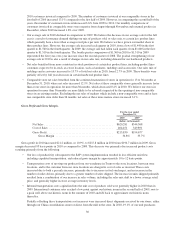
Our most significant asset is our merchandise inventory. Merchandise inventory is considered either “available for sale”
or “inbound in-transit,” based on whether we have physically received and inspected the products. We launched our initiative
to strengthen our in-stock commitment to our top selling products in the fourth quarter of 2009. The increase in 2010
available inventory per store is primarily a result of the adverse impact of our reduced productivity. Merchandise inventories
and available inventory per store in operation on December 31 were as follows:
2010 2009 2008
(in thousands)
Inventory—Available for Sale ............................. $136,179 $109,369 $75,521
Inventory—Inbound In-Transit ............................. 18,952 23,973 13,210
Total Merchandise Inventories ........................... $155,131 $133,342 $88,731
Available Inventory Per Store ............................ $ 611 $ 588 $ 503
26