Lumber Liquidators 2010 Annual Report Download - page 35
Download and view the complete annual report
Please find page 35 of the 2010 Lumber Liquidators annual report below. You can navigate through the pages in the report by either clicking on the pages listed below, or by using the keyword search tool below to find specific information within the annual report.-
 1
1 -
2
-
3
-
4
-
5
-
6
-
7
-
8
-
9
-
10
-
11
-
12
-
13
-
14
-
15
-
16
-
17
-
18
-
19
-
20
-
21
-
22
-
23
-
24
-
 25
25 -
 26
26 -
 27
27 -
 28
28 -
 29
29 -
 30
30 -
 31
31 -
 32
32 -
 33
33 -
 34
34 -
 35
35 -
 36
36 -
 37
37 -
 38
38 -
 39
39 -
 40
40 -
 41
41 -
 42
42 -
 43
43 -
 44
44 -
 45
45 -
46
-
47
-
48
-
49
-
50
-
51
-
52
-
53
-
54
-
55
-
56
-
57
-
58
-
59
-
60
-
61
-
62
-
63
-
64
-
65
-
66
-
67
-
68
-
69
-
70
-
71
-
72
 |
 |

flooring from China will be required to pay the applicable duty into escrow pending final determinations by the ITC. Until
the time of the ITC’s final determinations, which are expected later this year, the DOC may make adjustments to its
preliminary duty calculations. See “Item 1A. Risk Factors—Risks Related to Our Business and Industry.”
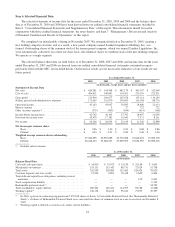
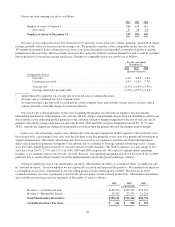
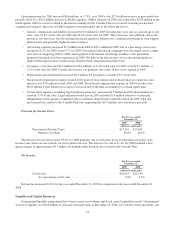
Results of Operations
The following tables set forth components of our results of operations for the periods indicated, both in dollars and as a
percentage of net sales.
Year Ended December 31,
2010 2009 2008
(in millions, except percentages
and number of stores)
Net sales ............................................................ $620.3 $544.6 $482.2
Comparable store net sales increase .................................. 2.1% 0.0% 1.6%
Number of stores opened in period ................................... 37 36 34
Cost of sales ......................................................... 404.5 349.9 314.5
Gross profit ......................................................... 215.8 194.7 167.7
SG&A expenses ...................................................... 173.7 151.1 130.7
Operating income .................................................... 42.2 43.6 37.0
Net income .......................................................... 26.3 26.9 22.1
Year Ended December 31,
2010 2009 2008
(% of net sales)
Net sales ............................................................ 100.0% 100.0% 100.0%
Cost of sales ......................................................... 65.2% 64.3% 65.2%
Gross profit ......................................................... 34.8% 35.7% 34.8%
SG&A expenses ...................................................... 28.0% 27.7% 27.1%
Operating income .................................................... 6.8% 8.0% 7.7%
Net income .......................................................... 4.2% 4.9% 4.6%
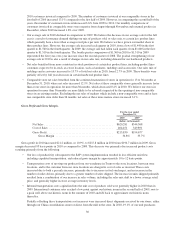
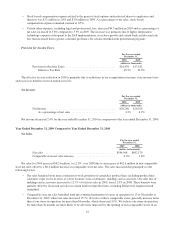
Year Ended December 31, 2010 Compared to Year Ended December 31, 2009
Net Sales.
For the year ended
December 31,
2010 2009
(dollars in thousands)
Net sales ................................................ $620,281 $544,568
Comparable store net sales increase ........................... 2.1% 0.0%
Net sales for 2010 increased $75.7 million, or 13.9%, over 2009 due to an increase of $64.2 million in non-comparable
store net sales and an $11.5 million increase in comparable store net sales. Net sales were impacted by the following:
• The loss of productivity following our SAP implementation weakened net sales at comparable stores in the second
half of 2010. As a result, we reversed a trend in quarterly net sales, which had gradually strengthened each quarter
since the beginning of 2009. In the first six months 2010, our net sales in comparable stores increased 6.7%
compared to the six months ended June 30, 2009. In contrast, when comparing the third and fourth quarters of 2010
to the same six months in 2009, our net sales at comparable stores decreased 2.3%. On a quarterly basis, net sales
at comparable stores decreased 5.7% in comparing the third quarters of 2010 and 2009, and increased 1.2% when
comparing the fourth quarters of 2010 and 2009.
• Net sales for 2010 benefited from an increase in the number of customers invoiced in our comparable stores. We
believe the increases in the number of customers invoiced resulted from strengthening consumer demand for our
expanded assortment of products, and the incremental traffic generated by certain promotional pricing. As
discussed above, the loss of productivity following the SAP implementation significantly impacted the number of
29