LensCrafters 2014 Annual Report Download - page 54
Download and view the complete annual report
Please find page 54 of the 2014 LensCrafters annual report below. You can navigate through the pages in the report by either clicking on the pages listed below, or by using the keyword search tool below to find specific information within the annual report.-
 1
1 -
2
-
3
-
4
-
5
-
6
-
7
-
8
-
9
-
10
-
11
-
12
-
13
-
14
-
15
-
16
-
17
-
18
-
19
-
20
-
21
-
22
-
23
-
24
-
25
-
26
-
27
-
28
-
29
-
30
-
31
-
32
-
33
-
34
-
35
-
36
-
37
-
38
-
39
-
40
-
41
-
42
-
43
-
 44
44 -
 45
45 -
 46
46 -
 47
47 -
 48
48 -
 49
49 -
 50
50 -
 51
51 -
 52
52 -
 53
53 -
 54
54 -
 55
55 -
 56
56 -
 57
57 -
 58
58 -
 59
59 -
 60
60 -
 61
61 -
 62
62 -
 63
63 -
 64
64 -
65
-
66
-
67
-
68
-
69
-
70
-
71
-
72
-
73
-
74
 |
 |
3.
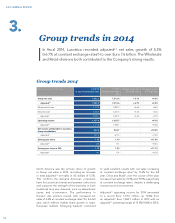
North America was the primary driver of growth
in Group net sales in 2014, recording an increase
in total adjusted2,3 net sales in US dollars of 5.3%.
This confirms the demand American consumers
have for Luxottica’s brands and eyewear collections
and supports the strength of the business in both
traditional and new channels, such as department
stores and e-commerce. The performance in
Europe5 was positive overall, with increased net
sales of 4.6% at constant exchange rates4 for the full
year, which reflects market share growth in major
European markets. Emerging markets5 continued
to yield excellent results with net sales increasing
at constant exchange rates4 by 17.6% for the full
year. China and Brazil5, over the course of the year,
increased net sales by 19.3% and 19.9% respectively
at constant exchange rates4, despite a challenging
macroeconomic environment.
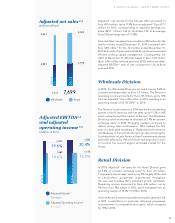
Adjusted2,3 operating income for 2014 amounted
to a record Euro 1,177.6 million, up 10.6% from
an adjusted2,3 Euro 1,064.7 million in 2013 with an
adjusted2,3 operating margin of 15.3% (14.6% in 2013).
In fiscal 2014, Luxottica recorded adjusted2,3 net sales growth of 5.3%
(+6.7% at constant exchange rates4) to over Euro 7.6 billion. The Wholesale
and Retail divisions both contributed to the Company’s strong results.
Group trends in 2014
Group trends 20141
(millions of Euro, except for EPS - in Euro)
at current exchange rates
FY 2013
at current exchange
rates
Change at constant
exchange rates4
Change at current
exchange rates
Group net sales 7,652.3 7,312.6 +6.1% +4.6%
Adjusted2,3 7,698.9 7,312.6 +6.7% +5.3%
Wholesale Division 3,193.8 2,991.3 +8.6% +6.8%
Retail Division 4,458.6 4,321.3 +4.3% +3.2%
Adjusted2,3 4,505.1 4,321.3 +5.4% +4.3%
Operating income 1,157.6 1,055.7 +9.7%
Adjusted2,3 1,177.6 1,064.7 +10.6%
Net income attributable to Luxottica
Group stockholders 642.6 544.7 +18.0%
Adjusted2,3 687.4 617.3 +11.4%
Earnings per share 1.35 1.15 +17.0%
Adjusted2,3 1.44 1.31 +10.4%
Earnings per share in US$ 1.79 1.53 +17.1%
Adjusted2,3 1.92 1.74 +10.5%
2014 ANNUAL REVIEW
52