LensCrafters 2014 Annual Report Download - page 50
Download and view the complete annual report
Please find page 50 of the 2014 LensCrafters annual report below. You can navigate through the pages in the report by either clicking on the pages listed below, or by using the keyword search tool below to find specific information within the annual report.-
 1
1 -
2
-
3
-
4
-
5
-
6
-
7
-
8
-
9
-
10
-
11
-
12
-
13
-
14
-
15
-
16
-
17
-
18
-
19
-
20
-
21
-
22
-
23
-
24
-
25
-
26
-
27
-
28
-
29
-
30
-
31
-
32
-
33
-
34
-
35
-
36
-
37
-
38
-
39
-
 40
40 -
 41
41 -
 42
42 -
 43
43 -
 44
44 -
 45
45 -
 46
46 -
 47
47 -
 48
48 -
 49
49 -
 50
50 -
 51
51 -
 52
52 -
 53
53 -
 54
54 -
 55
55 -
 56
56 -
 57
57 -
 58
58 -
 59
59 -
 60
60 -
61
-
62
-
63
-
64
-
65
-
66
-
67
-
68
-
69
-
70
-
71
-
72
-
73
-
74
 |
 |
2.7
Group headcount
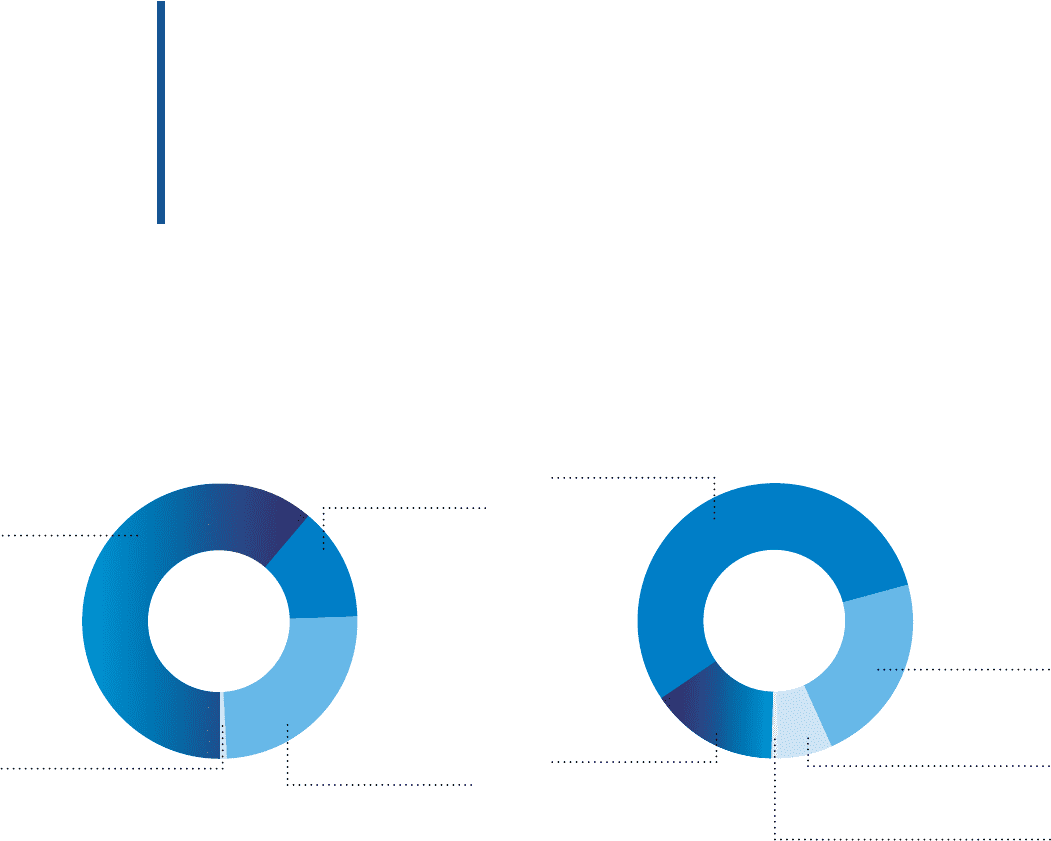
As of December 31, 2014, Luxottica Group had 77,734 employees, with
61.2% dedicated to the retail business, 13.3% dedicated to the wholesale
business and 24.9% dedicated to production and distribution activities.
Corporate central services based in Milan represent 0.6% of the total
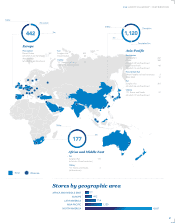
Group’s workforce. In terms of geographic distribution, 55.3% of Luxottica’s
employees work in North America, 15% in Europe, 22.7% in Asia-Pacific,
6.3% in Latin America and 0.7% in the Middle East and South Africa.
Luxotticans
Employees
by business area
Employees
by geographic area
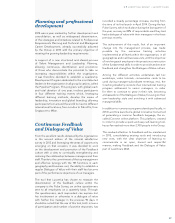
The elements on which the success of Luxottica and
its Human Resource management strategy in 2014
were based were attention to people, development
of abilities and skills, realization of potential and
creation of a work environment that offers everyone
the same opportunities based on the shared criteria
of merit and absence of discrimination. The strategic
pillars set forth above are detailed in the initiatives
and activities described below.
Retail 61.2%
47,551
Corporate 0.6%
465
Wholesale 13.3%
10,307
Operations 24.9%
19,441
2014 ANNUAL REVIEW
48
North America 55.3%
42,975
Asia-Pacific 22.7%
17,622
Latin America 6.3%
4,907
Middle East & South Africa 0.7%
560
Europe 15.0%
11,670