Hyundai 2006 Annual Report Download - page 99
Download and view the complete annual report
Please find page 99 of the 2006 Hyundai annual report below. You can navigate through the pages in the report by either clicking on the pages listed below, or by using the keyword search tool below to find specific information within the annual report.-
 1
1 -
2
-
3
-
4
-
5
-
6
-
7
-
8
-
9
-
10
-
11
-
12
-
13
-
14
-
15
-
16
-
17
-
18
-
19
-
20
-
21
-
22
-
23
-
24
-
25
-
26
-
27
-
28
-
29
-
30
-
31
-
32
-
33
-
34
-
35
-
36
-
37
-
38
-
39
-
40
-
41
-
42
-
43
-
44
-
45
-
46
-
47
-
48
-
49
-
50
-
51
-
52
-
53
-
54
-
55
-
56
-
57
-
58
-
59
-
60
-
61
-
62
-
63
-
64
-
65
-
66
-
67
-
68
-
69
-
70
-
71
-
72
-
73
-
74
-
75
-
76
-
77
-
78
-
79
-
80
-
81
-
82
-
83
-
84
-
85
-
86
-
87
-
88
-
 89
89 -
 90
90 -
 91
91 -
 92
92 -
 93
93 -
 94
94 -
 95
95 -
 96
96 -
 97
97 -
 98
98 -
 99
99 -
 100
100 -
 101
101 -
 102
102 -
 103
103 -
 104
104 -
 105
105 -
 106
106 -
 107
107 -
 108
108 -
 109
109 -
110
-
111
-
112
-
113
-
114
-
115
-
116
-
117
-
118
-
119
-
120
-
121
-
122
-
123
-
124
-
125
-
126
-
127
-
128
-
129
-
130
-
131
-
132
-
133
-
134
-
135
 |
 |
95
HYUNDAI MOTOR COMPANY AND SUBSIDIARIES
NOTES TO CONSOLIDATED FINANCIAL STATEMENTS
FOR THE YEARS ENDED DECEMBER 31, 2006 AND 2005
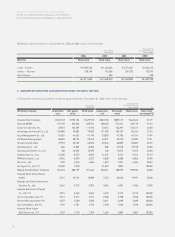
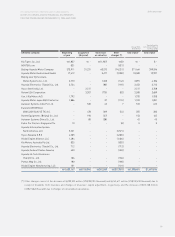
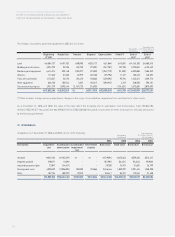
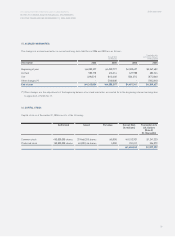
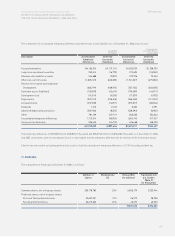
The changes in intangibles in 2006 are as follows:
Description Goodwill Negative Industrial Development Other Total Total
goodwill property costs
rights
Beginning of the year 476,343 (86,421) 24,912 1,830,297 84,991 2,330,122 $2,506,586
Addition:
Expenditures 107,398 (8,015) 12,569 824,966 36,896 973,814 1,047,562
Deduction:
Amortization (64,520) 6,455 (9,830) (567,537) (19,296) (654,728) (704,312)
Impairment loss - - - (25,026) - (25,026) (26,921)
Government subsidy - - - (12,066) - (12,066) (12,980)
Other 673 - 1,729 (4,188) 2,020 234 252
End of the year 519,894 (87,981) 29,380 2,046,446 104,611 2,612,350 $2,810,187
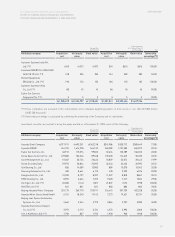
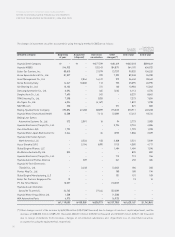
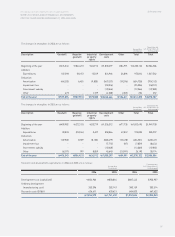
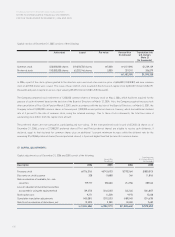
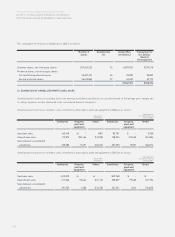
The changes in intangibles in 2005 are as follows:
Translation into
U.S. Dollars (Note 2)
(In thousands)
Korean Won
(In millions)
Description Goodwill Negative Industrial Development Other Total Total
goodwill property costs
rights
Beginning of the year 459,982 (72,313) 20,779 1,326,312 77,735 1,812,495 $1,949,758
Addition:
Expenditures 33,828 (23,016) 3,407 858,864 42,812 915,895 985,257
Deduction:
Amortization (10,950) 8,709 (8,133) (380,679) (13,478) (404,531) (435,167)
Impairment loss - - - (7,772) (87) (7,859) (8,454)
Government subsidy - - - (12,068) - (12,068) (12,982)
Other (6,517) 199 8,859 45,640 (21,991) 26,190 28,174
End of the year 476,343 (86,421) 24,912 1,830,297 84,991 2,330,122 $2,506,586
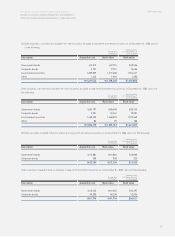
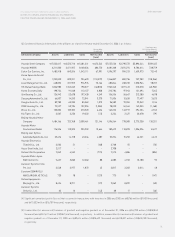
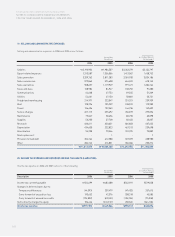
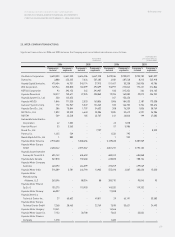
Research and development expenditures in 2006 and 2005 are as follows:
Translation into
U.S. Dollars (Note 2)
(In thousands)
Korean Won
(In millions)
Korean Won
(In millions)
Translation into
U.S. Dollars (Note 2)
(In thousands)
2006 2005 2006 2005
Development cost (capitalized) 824,966 858,864 $887,442 $923,907
Ordinary development
(manufacturing cost) 353,396 282,147 380,159 303,514
Research costs (SG&A) 636,611 620,621 684,823 667,622
1,814,973 1,761,632 $1,952,424 $1,895,043