Hyundai 2006 Annual Report Download - page 91
Download and view the complete annual report
Please find page 91 of the 2006 Hyundai annual report below. You can navigate through the pages in the report by either clicking on the pages listed below, or by using the keyword search tool below to find specific information within the annual report.-
 1
1 -
2
-
3
-
4
-
5
-
6
-
7
-
8
-
9
-
10
-
11
-
12
-
13
-
14
-
15
-
16
-
17
-
18
-
19
-
20
-
21
-
22
-
23
-
24
-
25
-
26
-
27
-
28
-
29
-
30
-
31
-
32
-
33
-
34
-
35
-
36
-
37
-
38
-
39
-
40
-
41
-
42
-
43
-
44
-
45
-
46
-
47
-
48
-
49
-
50
-
51
-
52
-
53
-
54
-
55
-
56
-
57
-
58
-
59
-
60
-
61
-
62
-
63
-
64
-
65
-
66
-
67
-
68
-
69
-
70
-
71
-
72
-
73
-
74
-
75
-
76
-
77
-
78
-
79
-
80
-
 81
81 -
 82
82 -
 83
83 -
 84
84 -
 85
85 -
 86
86 -
 87
87 -
 88
88 -
 89
89 -
 90
90 -
 91
91 -
 92
92 -
 93
93 -
 94
94 -
 95
95 -
 96
96 -
 97
97 -
 98
98 -
 99
99 -
 100
100 -
 101
101 -
102
-
103
-
104
-
105
-
106
-
107
-
108
-
109
-
110
-
111
-
112
-
113
-
114
-
115
-
116
-
117
-
118
-
119
-
120
-
121
-
122
-
123
-
124
-
125
-
126
-
127
-
128
-
129
-
130
-
131
-
132
-
133
-
134
-
135
 |
 |
87
HYUNDAI MOTOR COMPANY AND SUBSIDIARIES
NOTES TO CONSOLIDATED FINANCIAL STATEMENTS
FOR THE YEARS ENDED DECEMBER 31, 2006 AND 2005
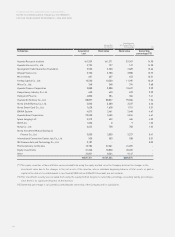
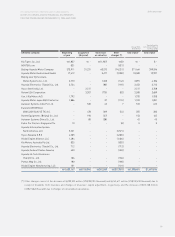
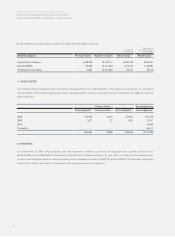
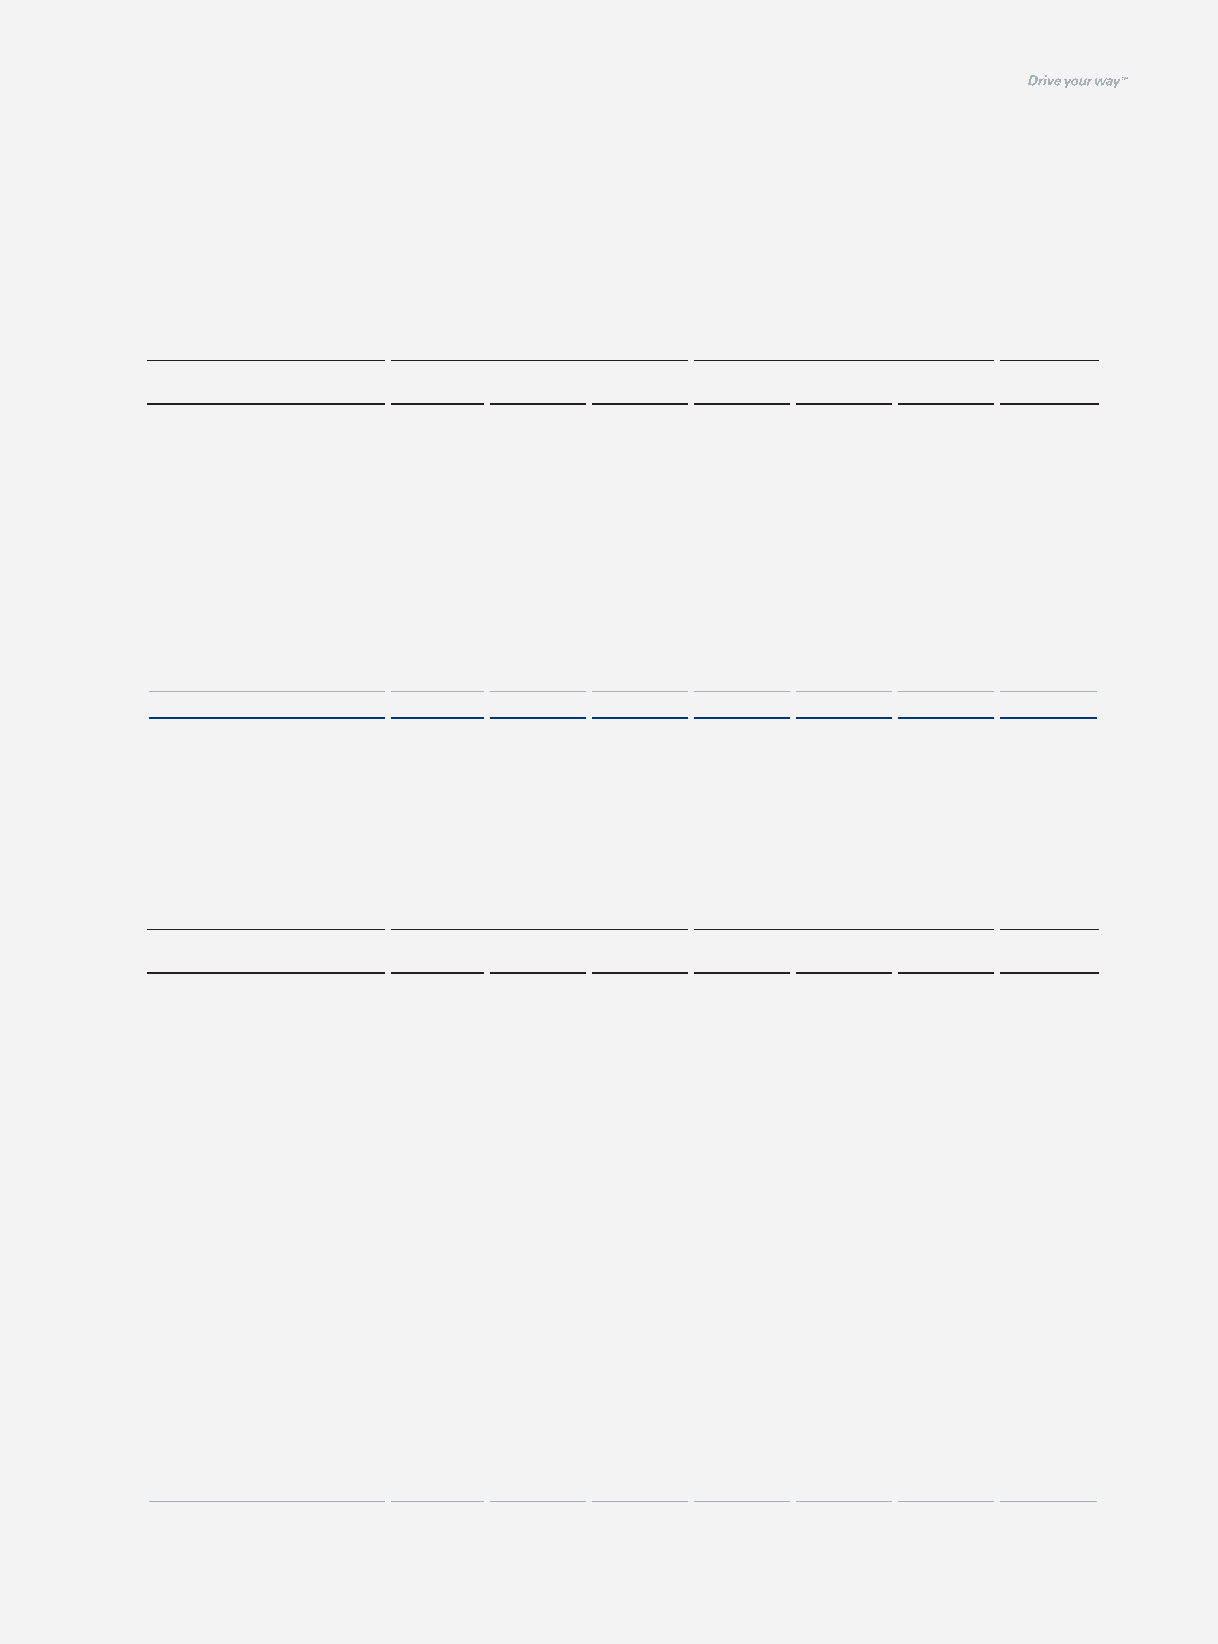
Affiliated company Acquisition Net equity Book value Acquisition Net equity Book value Ownership
cost value cost value percentage (*2)
Autoever Systems India Pvt.
Ltd. (*1) 50 572 572 $54 $615 $615 100.00
Eurotem DEMIRYOLU ARACLARI
SAN. VE TIC A.S. (*1) 478 355 355 514 382 382 50.50
Rotem Equipments
(Beijing) Co., Ltd. (*1) 190 153 153 204 165 165 100.00
Autoever Systems China
Co., Ltd. (*1) 80 42 42 86 45 45 90.00
Eukor Car Carriers
Singapore Pte. (*1) 5 5 5 5 5 5 20.00
1,005,679 2,226,797 1,578,401 $1,081,841 $2,395,436 $1,697,936
(*1) These companies are excluded in the consolidation since individual beginning balance of total assets is less than 7,000 million
(US$7,530 thousand).
(*2) Ownership percentage is calculated by combining the ownership of the Company and its subsidiaries.
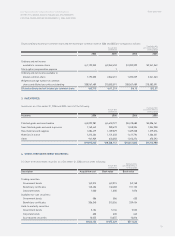
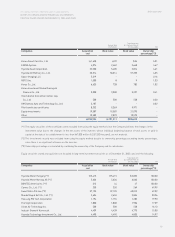
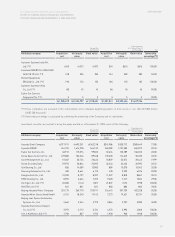
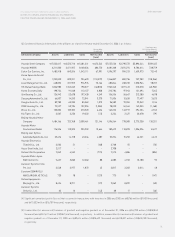
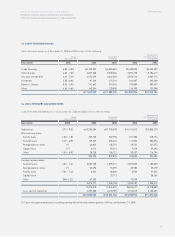
Investment securities accounted for using the equity method as of December 31, 2005 consist of the following:
(%)
Translation into
U.S. Dollars (Note 2)
(In thousands)
Korean Won
(In millions)
Affiliated company Acquisition Net equity Book value Acquisition Net equity Book value Ownership
cost value cost value percentage (*2)
Hyundai Steel Company 317,911 493,351 362,218 $341,986 $530,712 $389,649 27.80
Hyundai MOBIS 244,753 1,614,978 564,195 263,289 1,737,283 606,922 20.40
Eukor Car Carriers, Inc. 48,912 115,074 99,032 52,616 123,789 106,532 20.00
Korea Space & Aircraft Co., Ltd. 129,800 106,546 89,548 139,630 114,615 96,330 33.33
Asset Management Co., Ltd. 10,067 30,746 26,440 10,829 33,074 28,442 19.99
Korea Economy Daily 29,973 20,844 25,095 32,243 22,423 26,995 20.55
Iljin Bearing Co., Ltd 826 14,009 13,983 889 15,070 15,042 20.00
Daesung Automotive Co., Ltd. 400 8,641 6,113 430 9,295 6,576 20.00
Donghui Auto Co., Ltd. 10,530 8,197 8,237 11,327 8,818 8,861 35.10
TRW Steering Co., Ltd. 8,952 6,644 7,273 9,630 7,147 7,824 29.00
Kia Tigers Co., Ltd. (*1) 20,300 (116) 1,857 21,837 (125) 1,998 100.00
NGVTEK.com (*1) 821 821 821 883 883 883 78.05
Beijing-Hyundai Motor Company 201,179 369,710 373,911 216,415 397,709 402,228 50.00
Hyundai Motor Deutschland GmbH 6,761 18,240 17,412 7,273 19,621 18,731 30.00
Beijing Lear Dymos Automotive
Systems Co., Ltd. 2,662 2,544 2,773 2,864 2,737 2,983 40.00
Hyundai Electronics (Tianjin)
Co., Ltd. (*1) 3,972 3,712 3,724 4,273 3,993 4,006 100.00
Yan Ji Kia Motors A/S (*1) 1,792 837 1,792 1,928 900 1,928 100.00
(%)
Korean Won
(In millions)
Translation into
U.S. Dollars (Note 2)
(In thousands)