Hyundai 2006 Annual Report Download - page 92
Download and view the complete annual report
Please find page 92 of the 2006 Hyundai annual report below. You can navigate through the pages in the report by either clicking on the pages listed below, or by using the keyword search tool below to find specific information within the annual report.-
 1
1 -
2
-
3
-
4
-
5
-
6
-
7
-
8
-
9
-
10
-
11
-
12
-
13
-
14
-
15
-
16
-
17
-
18
-
19
-
20
-
21
-
22
-
23
-
24
-
25
-
26
-
27
-
28
-
29
-
30
-
31
-
32
-
33
-
34
-
35
-
36
-
37
-
38
-
39
-
40
-
41
-
42
-
43
-
44
-
45
-
46
-
47
-
48
-
49
-
50
-
51
-
52
-
53
-
54
-
55
-
56
-
57
-
58
-
59
-
60
-
61
-
62
-
63
-
64
-
65
-
66
-
67
-
68
-
69
-
70
-
71
-
72
-
73
-
74
-
75
-
76
-
77
-
78
-
79
-
80
-
81
-
 82
82 -
 83
83 -
 84
84 -
 85
85 -
 86
86 -
 87
87 -
 88
88 -
 89
89 -
 90
90 -
 91
91 -
 92
92 -
 93
93 -
 94
94 -
 95
95 -
 96
96 -
 97
97 -
 98
98 -
 99
99 -
 100
100 -
 101
101 -
 102
102 -
103
-
104
-
105
-
106
-
107
-
108
-
109
-
110
-
111
-
112
-
113
-
114
-
115
-
116
-
117
-
118
-
119
-
120
-
121
-
122
-
123
-
124
-
125
-
126
-
127
-
128
-
129
-
130
-
131
-
132
-
133
-
134
-
135
 |
 |

88
HYUNDAI MOTOR COMPANY AND SUBSIDIARIES
NOTES TO CONSOLIDATED FINANCIAL STATEMENTS
FOR THE YEARS ENDED DECEMBER 31, 2006 AND 2005
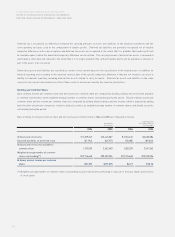
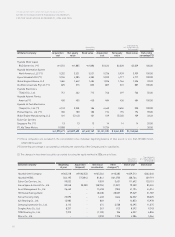
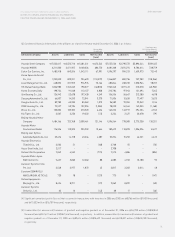
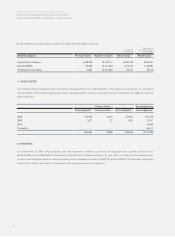
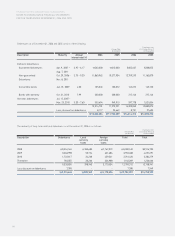
Affiliated company Acquisition Net equity Book value Acquisition Net equity Book value Ownership
cost value cost value percentage (*2)
Hyundai Motor Japan
R&D Center Inc. (*1) 1,510 1,885 1,886 $1,624 $2,028 $2,029 100.00
Hyundai Information System
North America, LLC (*1) 5,332 5,521 5,521 5,736 5,939 5,939 100.00
Hysco Slovakia S.R.O (*1) 5,196 4,385 4,385 5,590 4,717 4,717 100.00
Global Engine Alliance, LLC 1,484 1,642 1,484 1,596 1,766 1,596 33.33
Kia Motors Australia Pty Ltd. (*1) 825 215 825 887 231 887 100.00
Hyundai Electronics
(Tianjin) Co., Ltd. 712 462 712 766 497 766 50.00
Hyundai Autonet Pontus
America (*1) 450 405 450 484 436 484 100.00
Hyundai Hi-Tech Electronics
(Tianjin) Co., Ltd. (*1) 4,149 3,350 186 4,463 3,604 200 100.00
Pontus Map Co., Ltd. (*1) 180 180 180 194 194 194 90.00
Global Engine Manufacturing, LLC 101 (5,143) 101 109 (5,532) 109 33.33
Eukor Car Carriers
Singapore Pte. (*1) 13 13 13 14 14 14 20.00
PT. Kia Timor Motors 10,908 - - 11,734 - - 30.00
1,070,471 2,827,693 1,620,167 $1,151,539 $ 3,041,838 $1,742,865
(*1) These companies are excluded in the consolidation since individual beginning balance of total assets is less than 7,000 million
(US$7,530 thousand).
(*2) Ownership percentage is calculated by combining the ownership of the Company and its subsidiaries.
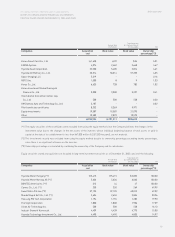
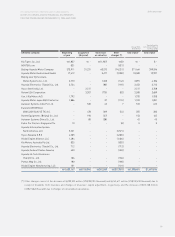
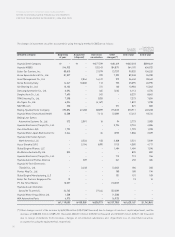
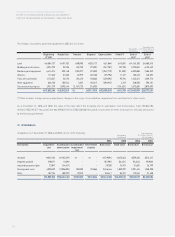
(2) The changes in investment securities accounted for using the equity method in 2006 are as follows:
(%)
Translation into
U.S. Dollars (Note 2)
(In thousands)
Korean Won
(In millions)
Translation into
U.S. Dollars (Note 2)
(In thousands)
Korean Won
(In millions)
Affiliated company Beginning Acquisition Gain (loss) Other End of year End of year
of year (disposal) on valuation changes (*)
Hyundai Steel Company 362,218 (108,353) 165,266 10,382 429,513 $462,040
Hyundai MOBIS 564,195 (75,894) 81,841 (161,378) 408,764 439,719
Eukor Car Carriers, Inc. 99,032 - 9,059 3,601 111,692 120,151
Korea Space & Aircraft Co., Ltd. 89,548 30,000 (38,994) (1,051) 79,503 85,524
Asset Management Co., Ltd. 26,440 - 15,458 (704) 41,194 44,314
HK Mutual Savings Bank - - (8,458) 38,007 29,549 31,787
Korea Economy Daily 25,095 - 1,403 (446) 26,052 28,025
Iljin Bearing Co., Ltd. 13,983 - 869 1 14,853 15,978
Daesung Automotive Co., Ltd. 6,113 - 674 3,508 10,295 11,075
Donghui Auto Co., Ltd. 8,237 - 367 (12) 8,592 9,243
TRW Steering Co., Ltd. 7,273 - (1,132) 186 6,327 6,806
Wisco Co., Ltd. - - 3,250 1,736 4,986 5,364