Hyundai 2006 Annual Report Download - page 63
Download and view the complete annual report
Please find page 63 of the 2006 Hyundai annual report below. You can navigate through the pages in the report by either clicking on the pages listed below, or by using the keyword search tool below to find specific information within the annual report.-
 1
1 -
2
-
3
-
4
-
5
-
6
-
7
-
8
-
9
-
10
-
11
-
12
-
13
-
14
-
15
-
16
-
17
-
18
-
19
-
20
-
21
-
22
-
23
-
24
-
25
-
26
-
27
-
28
-
29
-
30
-
31
-
32
-
33
-
34
-
35
-
36
-
37
-
38
-
39
-
40
-
41
-
42
-
43
-
44
-
45
-
46
-
47
-
48
-
49
-
50
-
51
-
52
-
 53
53 -
 54
54 -
 55
55 -
 56
56 -
 57
57 -
 58
58 -
 59
59 -
 60
60 -
 61
61 -
 62
62 -
 63
63 -
 64
64 -
 65
65 -
 66
66 -
 67
67 -
 68
68 -
 69
69 -
 70
70 -
 71
71 -
 72
72 -
 73
73 -
74
-
75
-
76
-
77
-
78
-
79
-
80
-
81
-
82
-
83
-
84
-
85
-
86
-
87
-
88
-
89
-
90
-
91
-
92
-
93
-
94
-
95
-
96
-
97
-
98
-
99
-
100
-
101
-
102
-
103
-
104
-
105
-
106
-
107
-
108
-
109
-
110
-
111
-
112
-
113
-
114
-
115
-
116
-
117
-
118
-
119
-
120
-
121
-
122
-
123
-
124
-
125
-
126
-
127
-
128
-
129
-
130
-
131
-
132
-
133
-
134
-
135
 |
 |

59
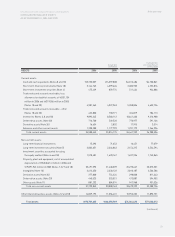
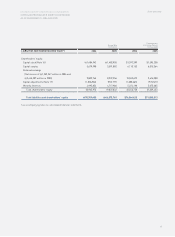
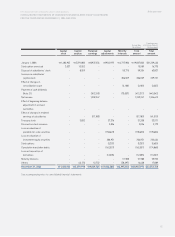
HYUNDAI MOTOR COMPANY AND SUBSIDIARIES
CONSOLIDATED BALANCE SHEETS
AS OF DECEMBER 31, 2006 AND 2005
ASSETS 2006 2005 2006 2005
Current assets:
Cash and cash equivalents (Notes 8 and 18) 3,730,007 4,397,808 $4,012,486 $4,730,861
Short-term financial instruments (Note 18) 3,144,765 4,399,626 3,382,923 4,732,816
Short-term investment securities (Note 4) 475,429 859,774 511,434 924,886
Trade notes and accounts receivable, less
allowance for doubtful accounts of 201,154
million in 2006 and 219,056 million in 2005
(Notes 18 and 23) 4,981,565 4,327,963 5,358,826 4,655,726
Trade notes and accounts receivable - other
(Notes 18 and 23) 422,800 730,771 454,819 786,113
Inventories (Notes 3, 8 and 18) 9,892,245 8,568,112 10,641,400 9,216,988
Deferred tax assets (Note 20) 716,700 549,520 770,977 591,136
Derivative assets (Note 26) 16,654 2,802 17,915 3,014
Advances and other current assets 1,200,280 1,177,799 1,291,179 1,266,996
Total current assets 24,580,445 25,014,175 26,441,959 26,908,536
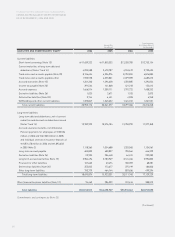
Non-current assets:
Long-term financial instruments 15,293 71,653 16,451 77,079
Long-term investment securities (Note 5) 2,002,651 2,346,863 2,154,315 2,524,594
Investment securities accounted for using
the equity method (Notes 6 and 18) 1,578,401 1,620,167 1,697,936 1,742,865
Property, plant and equipment, net of accumulated
depreciation of 8,348,614 million in 2006 and
9,891,942 million in 2005 (Notes 7, 8, 9 and 18) 23,491,593 21,448,039 25,270,647 23,072,331
Intangibles (Note 10) 2,612,350 2,330,122 2,810,187 2,506,586
Derivative assets (Note 26) 277,800 754,224 298,838 811,343
Deferred tax assets (Note 20) 440,525 553,021 473,887 594,902
Other assets (Note 11) 881,232 884,074 947,968 951,026
Total non-current assets 31,299,845 30,008,163 33,670,229 32,280,726
Other financial business assets (Notes 12 and 18) 14,829,195 11,056,431 15,952,232 11,893,751
Total assets 70,709,485 66,078,769 $76,064,420 $71,083,013
(continued)
Translation into
U.S. Dollars (Note 2)
(In thousands)
Korean Won
(In millions)