Hyundai 2006 Annual Report Download - page 85
Download and view the complete annual report
Please find page 85 of the 2006 Hyundai annual report below. You can navigate through the pages in the report by either clicking on the pages listed below, or by using the keyword search tool below to find specific information within the annual report.-
 1
1 -
2
-
3
-
4
-
5
-
6
-
7
-
8
-
9
-
10
-
11
-
12
-
13
-
14
-
15
-
16
-
17
-
18
-
19
-
20
-
21
-
22
-
23
-
24
-
25
-
26
-
27
-
28
-
29
-
30
-
31
-
32
-
33
-
34
-
35
-
36
-
37
-
38
-
39
-
40
-
41
-
42
-
43
-
44
-
45
-
46
-
47
-
48
-
49
-
50
-
51
-
52
-
53
-
54
-
55
-
56
-
57
-
58
-
59
-
60
-
61
-
62
-
63
-
64
-
65
-
66
-
67
-
68
-
69
-
70
-
71
-
72
-
73
-
74
-
 75
75 -
 76
76 -
 77
77 -
 78
78 -
 79
79 -
 80
80 -
 81
81 -
 82
82 -
 83
83 -
 84
84 -
 85
85 -
 86
86 -
 87
87 -
 88
88 -
 89
89 -
 90
90 -
 91
91 -
 92
92 -
 93
93 -
 94
94 -
 95
95 -
96
-
97
-
98
-
99
-
100
-
101
-
102
-
103
-
104
-
105
-
106
-
107
-
108
-
109
-
110
-
111
-
112
-
113
-
114
-
115
-
116
-
117
-
118
-
119
-
120
-
121
-
122
-
123
-
124
-
125
-
126
-
127
-
128
-
129
-
130
-
131
-
132
-
133
-
134
-
135
 |
 |

81
HYUNDAI MOTOR COMPANY AND SUBSIDIARIES
NOTES TO CONSOLIDATED FINANCIAL STATEMENTS
FOR THE YEARS ENDED DECEMBER 31, 2006 AND 2005
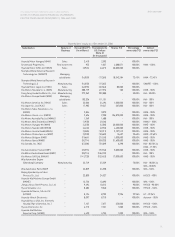
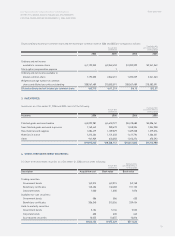
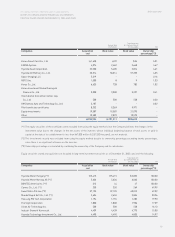
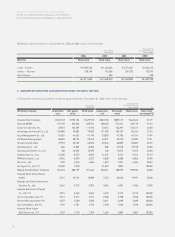
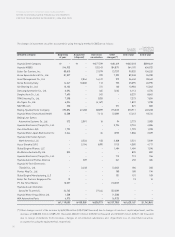
(2) Equity securities stated at fair value included in long-term investment securities as of December 31, 2005 consist of the following:
Korean Won
(In millions) (%)
Translation into
U.S. Dollars (Note 2)
(In thousands)
Companies Acquisition Book value Book value Ownership
cost percentage (*2)
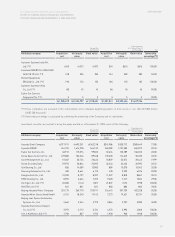
Hyundai Development Company 12,786 36,210 $38,952 0.85
LG Telecom, Ltd. 9,795 18,086 19,456 0.68
Hyundai Merchant Marine Co., Ltd. 9,568 15,319 16,479 0.49
Kanglim Co., Ltd. 347 50 54 0.38
Hyundai Corporation 13,626 1,743 1,875 0.37
KT Freetel 18,000 16,552 17,806 0.30
SeAH Besteel Co., Ltd. 854 1,422 1,530 0.17
Tong Yang Investment Bank 282 127 137 0.01
Treasury Stock Fund 26,647 17,948 19,307 -
SK Networks Co., Ltd. (*1) 363 1,346 1,447 -
Other 90 2 2 -
187,960 499,788 $537,638
(*1) Disposal of stocks is restricted.
(*2) Ownership percentage is calculated by combining the ownership of the Company and its subsidiaries.
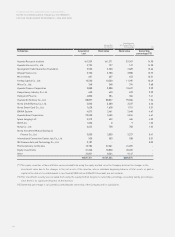
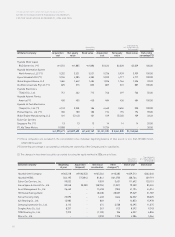
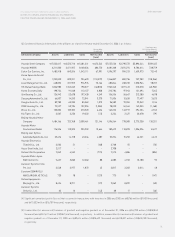
Equity securities stated at fair value included in long-term investment securities as of December 31, 2005 consist of the following:
Korean Won
(In millions) (%)
Translation into
U.S. Dollars (Note 2)
(In thousands)
Companies Acquisition Book value Book value Ownership
cost percentage (*2)
KOENTEC 1,550 4,604 $4,953 6.20
Saehan Media (*1) 4,933 4,450 4,787 4.90
Korea Information Service, Inc. 5,252 4,119 4,431 4.41
Jin Heung Mutual Savings Bank 2,166 3,097 3,332 3.33
Daewoo Engineering & Construction Co., Ltd. 42,483 136,996 147,371 3.01
Hyundai Heavy Industries Co., Ltd. 56,924 168,411 181,165 2.88
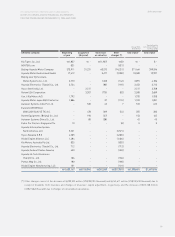
Daewoo International Corporation 9,822 90,652 97,517 2.50
Hyundai Information Technology Co., Ltd. 10,000 2,790 3,001 2.21
LG Telecom, Ltd. 9,795 12,483 13,428 0.68
Hyundai Development Company 12,786 29,198 31,409 0.85
Hyundai Corporation 13,626 1,513 1,628 1.08
Doosan Industrial Development Co., Ltd. 2,186 5,723 6,156 0.58
Hyundai Merchant Marine Co., Ltd. 7,329 7,645 8,224 0.55
SsangYong Cement Industrial Co., Ltd. 6,394 5,405 5,814 0.50
Kanglim Co., Ltd. 347 55 59 0.38
KT Freetel 18,000 13,715 14,754 0.30
Hyundai Engineering & Construction Co., Ltd. 13,332 13,302 14,309 0.27
SeAH Besteel Co., Ltd. 854 1,269 1,365 0.17