Hyundai 2006 Annual Report Download - page 71
Download and view the complete annual report
Please find page 71 of the 2006 Hyundai annual report below. You can navigate through the pages in the report by either clicking on the pages listed below, or by using the keyword search tool below to find specific information within the annual report.-
 1
1 -
2
-
3
-
4
-
5
-
6
-
7
-
8
-
9
-
10
-
11
-
12
-
13
-
14
-
15
-
16
-
17
-
18
-
19
-
20
-
21
-
22
-
23
-
24
-
25
-
26
-
27
-
28
-
29
-
30
-
31
-
32
-
33
-
34
-
35
-
36
-
37
-
38
-
39
-
40
-
41
-
42
-
43
-
44
-
45
-
46
-
47
-
48
-
49
-
50
-
51
-
52
-
53
-
54
-
55
-
56
-
57
-
58
-
59
-
60
-
 61
61 -
 62
62 -
 63
63 -
 64
64 -
 65
65 -
 66
66 -
 67
67 -
 68
68 -
 69
69 -
 70
70 -
 71
71 -
 72
72 -
 73
73 -
 74
74 -
 75
75 -
 76
76 -
 77
77 -
 78
78 -
 79
79 -
 80
80 -
 81
81 -
82
-
83
-
84
-
85
-
86
-
87
-
88
-
89
-
90
-
91
-
92
-
93
-
94
-
95
-
96
-
97
-
98
-
99
-
100
-
101
-
102
-
103
-
104
-
105
-
106
-
107
-
108
-
109
-
110
-
111
-
112
-
113
-
114
-
115
-
116
-
117
-
118
-
119
-
120
-
121
-
122
-
123
-
124
-
125
-
126
-
127
-
128
-
129
-
130
-
131
-
132
-
133
-
134
-
135
 |
 |

67
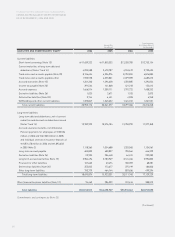
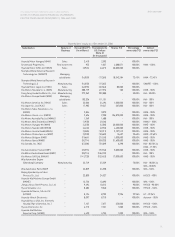
HYUNDAI MOTOR COMPANY AND SUBSIDIARIES
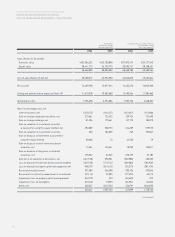
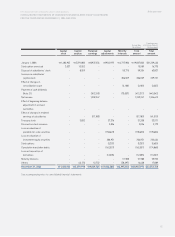
CONSOLIDATED STATEMENTS OF CASH FLOWS (CONTINUED)
FOR THE YEARS ENDED DECEMBER 31, 2006 AND 2005
2006 2005 2006 2005
Cash flows from operating activities:
Changes in operating assets and liabilities:
Increase in trade notes and accounts receivable (1,291,836) (1,424,044) $(1,389,669) $(1,531,889)
Decrease (increase) in trade notes and
accounts receivable - other 336,090 (37,293) 361,543 (40,117)
Increase in inventories (1,336,088) (1,217,301) (1,437,272) (1,309,489)
Increase in advances and other current assets (6,922) (280,761) (7,447) (302,024)
Increase in deferred tax assets (60,406) (68,456) (64,981) (73,640)
Increase (decrease) in trade notes and
accounts payable 1,790,118 (37,992) 1,925,686 (40,869)
Increase (decrease) in accounts payable-other (2,034,784) 1,961,992 (2,188,881) 2,110,577
Increase (decrease) in income tax payable 244,671 (377,042) 263,200 (405,596)
Increase in accrued expenses 371,649 291,014 399,795 313,053
Increase (decrease) in deferred tax liabilities 88,602 (56,777) 95,312 (61,077)
Increase in withholding and other current liabilities 53,974 491,193 58,062 528,392
Decrease in accrued warranties (498,521) (813,406) (536,275) (875,006)
Payment of severance benefits (728,662) (423,551) (783,845) (455,627)
Decrease (increase) in individual severance
insurance deposits 41,951 (168,724) 45,128 (181,502)
Other 15,757 115,102 16,952 123,818
3,226,269 4,438,101 3,470,599 4,774,205
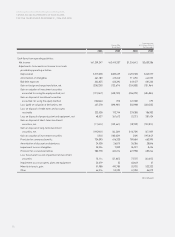
Cash flows from investing activities:
Cash inflows from investing activities:
Proceeds from withdrawal of short-term
financial instruments 4,911,028 1,796,383 5,282,948 1,932,426
Proceeds from disposal of short-term
investment securities 791,134 4,503,359 851,048 4,844,405
Proceeds from disposal of long-term investment
securities 1,366,787 995,006 1,470,296 1,070,359
Proceeds from disposal of investment securities
accounted for using the equity method 145,641 - 156,671 -
Proceeds from disposal of property,
plant and equipment 238,122 211,995 256,155 228,050
Reduction in other current assets 20,004 130,255 21,519 140,119
Reduction in other assets 410,602 302,506 441,696 325,416
7,883,318 7,939,504 8,480,333 8,540,775
(Continued)
Korean Won
(In millions)
Translation into
U.S. Dollars (Note 2)
(In thousands)