Hyundai 2006 Annual Report Download - page 101
Download and view the complete annual report
Please find page 101 of the 2006 Hyundai annual report below. You can navigate through the pages in the report by either clicking on the pages listed below, or by using the keyword search tool below to find specific information within the annual report.-
 1
1 -
2
-
3
-
4
-
5
-
6
-
7
-
8
-
9
-
10
-
11
-
12
-
13
-
14
-
15
-
16
-
17
-
18
-
19
-
20
-
21
-
22
-
23
-
24
-
25
-
26
-
27
-
28
-
29
-
30
-
31
-
32
-
33
-
34
-
35
-
36
-
37
-
38
-
39
-
40
-
41
-
42
-
43
-
44
-
45
-
46
-
47
-
48
-
49
-
50
-
51
-
52
-
53
-
54
-
55
-
56
-
57
-
58
-
59
-
60
-
61
-
62
-
63
-
64
-
65
-
66
-
67
-
68
-
69
-
70
-
71
-
72
-
73
-
74
-
75
-
76
-
77
-
78
-
79
-
80
-
81
-
82
-
83
-
84
-
85
-
86
-
87
-
88
-
89
-
90
-
 91
91 -
 92
92 -
 93
93 -
 94
94 -
 95
95 -
 96
96 -
 97
97 -
 98
98 -
 99
99 -
 100
100 -
 101
101 -
 102
102 -
 103
103 -
 104
104 -
 105
105 -
 106
106 -
 107
107 -
 108
108 -
 109
109 -
 110
110 -
 111
111 -
112
-
113
-
114
-
115
-
116
-
117
-
118
-
119
-
120
-
121
-
122
-
123
-
124
-
125
-
126
-
127
-
128
-
129
-
130
-
131
-
132
-
133
-
134
-
135
 |
 |
97
HYUNDAI MOTOR COMPANY AND SUBSIDIARIES
NOTES TO CONSOLIDATED FINANCIAL STATEMENTS
FOR THE YEARS ENDED DECEMBER 31, 2006 AND 2005
Korean Won
(In millions)
Annual
interest rate (%)
Translation into
U.S. Dollars (Note 2)
(In thousands)
Description 2006 2006 2005 2006 2005
Trade financing 6.00 ~ 7.00 5,103,337 4,883,681 $5,489,820 $5,253,529
General loans 4.00 ~ 7.00 2,879,230 2,030,634 3,097,278 2,184,417
Discount of trade bills 4.61 ~ 5.29 2,674,219 3,632,053 2,876,742 3,907,114
Overdrafts 5.50 ~ 6.86 97,549 274,519 104,937 295,309
Banker’s Usance 0.33 ~ 5.93 741,643 914,445 797,809 983,697
Other 4.63 ~ 4.65 143,344 120,000 154,199 129,088
11,639,322 11,855,332 $12,520,785 $12,753,154
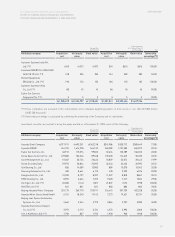
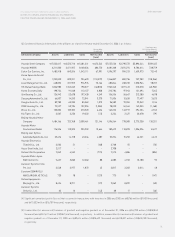
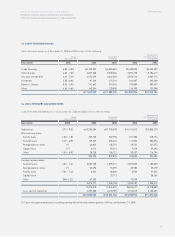
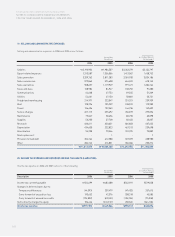
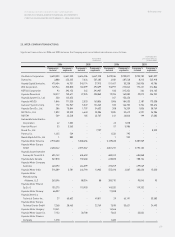
13. SHORT-TERM BORROWINGS:
Short-term borrowings as of December 31, 2006 and 2005 consist of the following:
Korean Won
(In millions)
Annual
interest rate (%)
Translation into
U.S. Dollars (Note 2)
(In thousands)
Description 2006 2006 2005 2006 2005
Debentures 3.75 ~ 9.20 13,306,584 11,950,259 $14,314,312 $12,855,270
Won currency loans:
Facility loans 1.00 ~ 7.38 205,705 202,796 221,283 218,154
General loans 5.49 ~ 6.89 109,537 358,431 117,832 385,576
Reorganization claims (*) 46,044 136,721 49,531 147,075
Capital lease 7.77 6,711 55,214 7,219 59,395
Other 1.00 ~ 6.90 28,758 106,712 30,937 114,794
396,755 859,874 426,802 924,994
Foreign currency loans:
General loans 4.02 ~ 7.24 3,581,798 1,099,747 3,853,053 1,183,032
Reorganization claims (*) 22,296 55,292 23,985 59,479
Facility loans 7.31 ~ 7.43 3,644 48,006 3,920 51,642
Capital lease - - 33,713 - 36,266
Other 3ML+1.20 67,433 - 72,539 -
3,675,171 1,236,758 3,953,497 1,330,419
17,378,510 14,046,891 18,694,611 15,110,683
Less: current maturities 4,595,588 3,470,787 4,943,619 3,733,635
12,782,922 10,576,104 $13,750,992 $11,377,048
(*) 3 year non-guaranteed bond circulating earning rate at the end of every quarter; 5.04% as of December 31, 2006
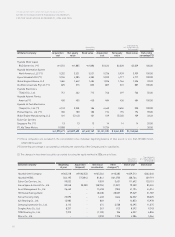
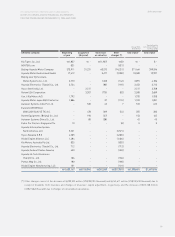
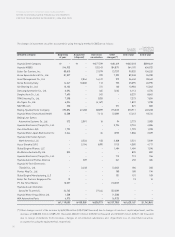
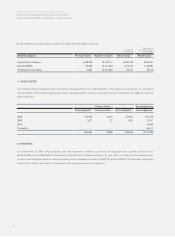
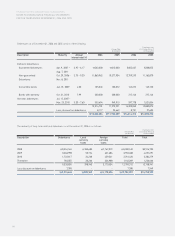
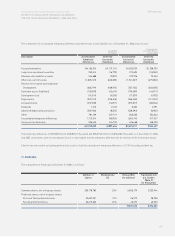
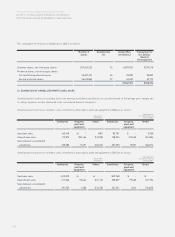
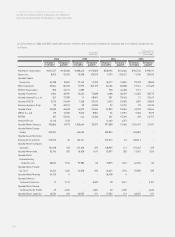
14. LONG-TERM DEBT AND DEBENTURES:
Long-term debt and debentures as of December 31, 2006 and 2005 consist of the following: