Hyundai 2006 Annual Report Download - page 104
Download and view the complete annual report
Please find page 104 of the 2006 Hyundai annual report below. You can navigate through the pages in the report by either clicking on the pages listed below, or by using the keyword search tool below to find specific information within the annual report.-
 1
1 -
2
-
3
-
4
-
5
-
6
-
7
-
8
-
9
-
10
-
11
-
12
-
13
-
14
-
15
-
16
-
17
-
18
-
19
-
20
-
21
-
22
-
23
-
24
-
25
-
26
-
27
-
28
-
29
-
30
-
31
-
32
-
33
-
34
-
35
-
36
-
37
-
38
-
39
-
40
-
41
-
42
-
43
-
44
-
45
-
46
-
47
-
48
-
49
-
50
-
51
-
52
-
53
-
54
-
55
-
56
-
57
-
58
-
59
-
60
-
61
-
62
-
63
-
64
-
65
-
66
-
67
-
68
-
69
-
70
-
71
-
72
-
73
-
74
-
75
-
76
-
77
-
78
-
79
-
80
-
81
-
82
-
83
-
84
-
85
-
86
-
87
-
88
-
89
-
90
-
91
-
92
-
93
-
 94
94 -
 95
95 -
 96
96 -
 97
97 -
 98
98 -
 99
99 -
 100
100 -
 101
101 -
 102
102 -
 103
103 -
 104
104 -
 105
105 -
 106
106 -
 107
107 -
 108
108 -
 109
109 -
 110
110 -
 111
111 -
 112
112 -
 113
113 -
 114
114 -
115
-
116
-
117
-
118
-
119
-
120
-
121
-
122
-
123
-
124
-
125
-
126
-
127
-
128
-
129
-
130
-
131
-
132
-
133
-
134
-
135
 |
 |

100
HYUNDAI MOTOR COMPANY AND SUBSIDIARIES
NOTES TO CONSOLIDATED FINANCIAL STATEMENTS
FOR THE YEARS ENDED DECEMBER 31, 2006 AND 2005
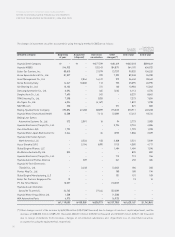
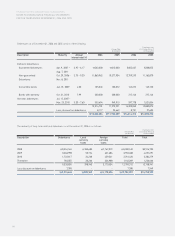
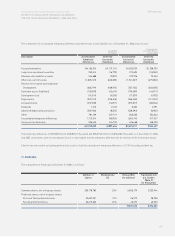
Capital stock as of December 31, 2005 consists of the following:
Authorized Issued Par value Korean Won Translation into
(In millions) U.S. Dollars
(Note 2)
(In thousands)
Common stock 450,000,000 shares 219,058,702 shares 5,000 1,151,894 $1,239,129
Preferred stock 150,000,000 shares 65,202,146 shares 5,000 331,011 356,079
1,482,905 $1,595,208
In 2006, a part of the stock options granted to the directors were exercised at an exercise price of 26,800 (US$28.83) and new common
stock of 407,553 shares were issued. This issue of new common stock resulted in the increase in capital stock by 2,037 million (US$2,191
thousand) and paid-in capital in excess of par value by 13,552 million (US$14,578 thousand).
The Company completed stock retirement of 1,320,000 common shares of treasury stock on May 4, 2004, which had been acquired for the
purpose of such retirement based on the decision of the Board of Directors on March 12, 2004. Also, the Company acquired treasury stock
after cancellation of Trust Cash Fund on March 2, 2001, and in accordance with the decision of the Board of Directors, on March 5, 2001, the
Company retired 10,000,000 common shares in treasury and 1,000,000 second preferred shares in treasury, which had additional dividend
rate of 2 percent to the rate of common stock, using the retained earnings. Due to these stock retirements, the total face value of
outstanding stock differs from the capital stock amount.
The preferred shares are non-cumulative, participating and non-voting. Of the total preferred stock issued of 65,202,146 shares as of
December 31, 2006, a total of 27,588,281 preferred shares (First and Third preferred shares) are eligible to receive cash dividends, if
declared, equal to that declared for common shares plus an additional 1 percent minimum increase while the dividend rate for the
remaining 37,613,865 preferred shares (Second preferred shares) is 2 percent higher than that declared for common shares.
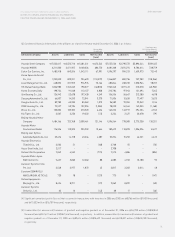
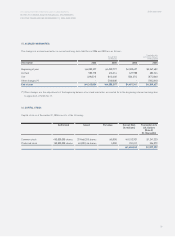
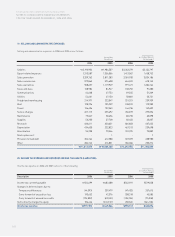
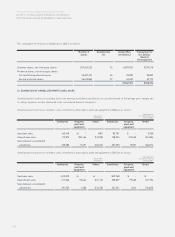
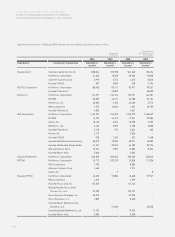
17. CAPITAL ADJUSTMENTS:
Capital adjustments as of December 31, 2006 and 2005 consist of the following:
Korean Won
(In millions)
Translation into
U.S. Dollars (Note 2)
(In thousands)
Description 2006 2005 2006 2005
Treasury stock (716,316) (743,692) $(770,564) $(800,013)
Discounts on stock issuance 338 (1,688) 364 (1,816)
Gain on valuation of available-for- sale
securities 199,777 358,400 214,906 385,542
Loss on valuation of investment securities
accounted for using the equity method (39,270) (246,220) (42,244) (264,867)
Stock option cost 9,271 14,528 9,973 15,628
Cumulative translation adjustments (455,081) (292,525) (489,545) (314,678)
Gain (loss) on valuation of derivatives, net (3,305) 9,000 (3,555) 9,682
(1,004,586) (902,197) $(1,080,665) $(970,522)