Hormel Foods 2015 Annual Report Download - page 60
Download and view the complete annual report
Please find page 60 of the 2015 Hormel Foods annual report below. You can navigate through the pages in the report by either clicking on the pages listed below, or by using the keyword search tool below to find specific information within the annual report.-
 1
1 -
2
-
3
-
4
-
5
-
6
-
7
-
8
-
9
-
10
-
11
-
12
-
13
-
14
-
15
-
16
-
17
-
18
-
19
-
20
-
21
-
22
-
23
-
24
-
25
-
26
-
27
-
28
-
29
-
30
-
31
-
32
-
33
-
34
-
35
-
36
-
37
-
38
-
39
-
40
-
41
-
42
-
43
-
44
-
45
-
46
-
47
-
48
-
49
-
 50
50 -
 51
51 -
 52
52 -
 53
53 -
 54
54 -
 55
55 -
 56
56 -
 57
57 -
 58
58 -
 59
59 -
 60
60 -
 61
61 -
 62
62 -
 63
63 -
 64
64 -
 65
65 -
 66
66 -
 67
67 -
 68
68 -
 69
69 -
 70
70
 |
 |

58
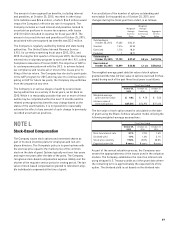
approved by the Company’s Board of Directors and the stock
price on the grant date. The expected volatility assumption is
set based primarily on historical volatility. As a reasonable-
ness test, implied volatility from exchange traded options is
also examined to validate the volatility range obtained from
the historical analysis. The expected life assumption is set
based on an analysis of past exercise behavior by option
holders. In performing the valuations for option grants, the
Company has not stratifi ed option holders as exercise behav-
ior has historically been consistent across all employee and
non-employee director groups.
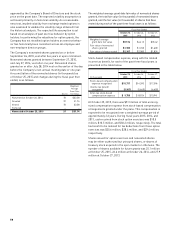
The Company’s nonvested shares granted on or before
September 26, 2010, vest after fi ve years or upon retirement.
Nonvested shares granted between September 27, 2010,
and July 27, 2014, vest after one year. Nonvested shares
granted on or after July 28, 2014 vest on the earlier of the day
before the Company’s next annual meeting date or one year.
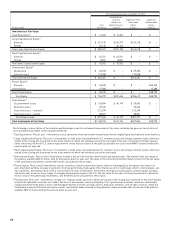
A reconciliation of the nonvested shares (in thousands) as
of October 25, 2015 and changes during the fi scal year then
ended, is as follows:
Weighted-
Average
Grant Date
Shares Fair Value
Nonvested at October 26, 2014 70 $ 33.58
Granted 37 51.74
Vested 70 33.58
Forfeited – –
Nonvested at October 25, 2015 37 $ 51.74
The weighted-average grant date fair value of nonvested shares
granted, the total fair value (in thousands) of nonvested shares
granted, and the fair value (in thousands) of shares that have
vested during each of the past three fi scal years is as follows:
Fiscal Year Ended
October 25, October 26, October 27,
2015 2014 2013
Weighted-average
grant date fair value $ 51.74 $ 44.12 $ 35.42
Fair value of nonvested
shares granted $ 1,920 $ 1,760 $ 1,600
Fair value of shares vested $ 2,347 $ 2,085 $ 1,824
Stock-based compensation expense, along with the related
income tax benefi t, for each of the past three fi scal years is
presented in the table below:
Fiscal Year Ended
October 25, October 26, October 27,
(in thousands) 2015 2014 2013
Stock-based compensation
expense recognized $ 15,717 $ 14,393 $ 17,596
Income tax benefi t
recognized (5,967) (5,469) (6,655)
After-tax stock-based
compensation expense $ 9,750 $ 8,924 $ 10,941
At October 25, 2015, there was $9.3 million of total unrecog-
nized compensation expense from stock-based compensation
arrangements granted under the plans. This compensation is
expected to be recognized over a weighted-average period of
approximately 2.6 years. During fi scal years 2015, 2014, and
2013, cash received from stock option exercises was $10.5
million, $10.5 million, and $30.2 million, respectively. The total
tax benefi t to be realized for tax deductions from these option
exercises was $25.6 million, $28.4 million, and $29.4 million,
respectively.
Shares issued for option exercises and nonvested shares
may be either authorized but unissued shares, or shares of
treasury stock acquired in the open market or otherwise. The
number of shares available for future grants was 25.1 million
at October 25, 2015, 26.6 million at October 26, 2014, and 27.9
million at October 27, 2013.