Hormel Foods 2015 Annual Report Download - page 26
Download and view the complete annual report
Please find page 26 of the 2015 Hormel Foods annual report below. You can navigate through the pages in the report by either clicking on the pages listed below, or by using the keyword search tool below to find specific information within the annual report.-
 1
1 -
2
-
3
-
4
-
5
-
6
-
7
-
8
-
9
-
10
-
11
-
12
-
13
-
14
-
15
-
 16
16 -
 17
17 -
 18
18 -
 19
19 -
 20
20 -
 21
21 -
 22
22 -
 23
23 -
 24
24 -
 25
25 -
 26
26 -
 27
27 -
 28
28 -
 29
29 -
 30
30 -
 31
31 -
 32
32 -
 33
33 -
 34
34 -
 35
35 -
 36
36 -
37
-
38
-
39
-
40
-
41
-
42
-
43
-
44
-
45
-
46
-
47
-
48
-
49
-
50
-
51
-
52
-
53
-
54
-
55
-
56
-
57
-
58
-
59
-
60
-
61
-
62
-
63
-
64
-
65
-
66
-
67
-
68
-
69
-
70
 |
 |

24
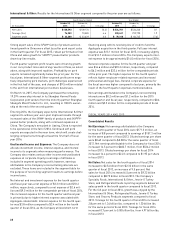
Income Taxes: The Company’s effective tax rate for the fi scal 2014 fourth quarter and year was 34.1 percent and 34.3 percent,
respectively, compared to 33.9 percent and 33.6 percent, respectively, for the fourth quarter and year in fi scal 2013. The higher
rate for fi scal 2014 is due to the impact of net favorable adjustments and settlements with various state jurisdictions in fi scal
2013.
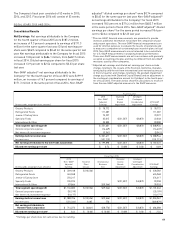
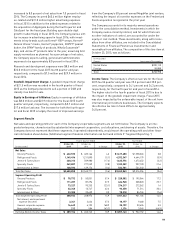
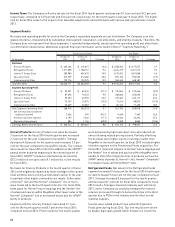
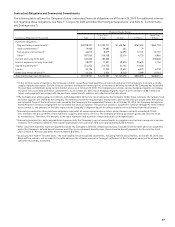
Segment Results
Net sales and operating profi ts for each of the Company’s reportable segments are set forth below. The Company is an inte-
grated enterprise, characterized by substantial intersegment cooperation, cost allocations, and sharing of assets. Therefore, the
Company does not represent that these segments, if operated independently, would report the operating profi t and other fi nan-
cial information shown below. (Additional segment fi nancial information can be found in Note P “Segment Reporting.”)
Fourth Quarter Ended Year Ended
October 26, October 27, October 26, October 27,
(in thousands) 2014 2013 % Change 2014 2013 % Change
Net Sales
Grocery Products $ 405,166 $ 419,615 (3.4) $ 1,558,265 $ 1,517,557 2.7
Refrigerated Foods 1,211,890 1,108,157 9.4 4,644,179 4,251,515 9.2
Jennie-O Turkey Store 509,980 459,670 10.9 1,672,452 1,601,868 4.4
Specialty Foods 277,559 212,485 30.6 907,120 932,533 (2.7)
International & Other 139,176 123,275 12.9 534,240 448,181 19.2
Total Net Sales $ 2,543,771 $ 2,323,202 9.5 $ 9,316,256 $ 8,751,654 6.5
Segment Operating Profi t
Grocery Products $ 50,051 $ 63,476 (21.1) $ 195,064 $ 213,646 (8.7)
Refrigerated Foods 87,296 79,453 9.9 338,020 232,692 45.3
Jennie-O Turkey Store 95,253 65,550 45.3 272,362 222,117 22.6
Specialty Foods 13,747 15,975 (13.9) 71,514 88,873 (19.5)
International & Other 22,629 22,069 2.5 84,745 71,490 18.5
Total Segment Operating Profi t 268,976 246,523 9.1 961,705 828,818 16.0
Net interest and investment
expense (income) 2,626 595 341.3 9,468 7,482 26.5
General corporate expense 6,192 7,466 (17.1) 33,434 26,694 25.2
Noncontrolling interest 584 1,145 (49.0) 3,349 3,865 (13.4)
Earnings Before Income Taxes $ 260,742 $ 239,607 8.8 $ 922,152 $ 798,507 15.5
Grocery Products: Grocery Products net sales decreased
3.4 percent for the fi scal 2014 fourth quarter and increased
2.7 percent for the year compared to fi scal 2013. Tonnage
decreased 4.8 percent for the quarter and increased 3.3 per-
cent for the year compared to fi scal 2013 results. The compar-
ative results for fi scal 2014 refl ect the addition of the SKIPPY®
peanut butter business beginning in the second quarter of
fi scal 2013. SKIPPY® products contributed an incremental
$73.3 million of net sales and 49.1 million lbs. to the results
for fi scal 2014.
Net sales for Grocery Products in the fourth quarter of fi scal
2014 were negatively impacted by lower tonnage in the canned
meat portfolio due to pricing actions taken earlier in the year
to partially offset higher commodity cost inputs. Softer sales
of Hormel® chili and the Hormel® Compleats® line of micro-
wave meals led to the fourth quarter decline. For fi scal 2014,
sales gains for Hormel® bacon toppings and the Herdez® line
of salsas and sauces within MegaMex offset lower sales of the
Hormel® Compleats® line of microwave meals and the SPAM®
family of products.
Segment profi t for Grocery Products decreased 21.1 per-
cent for the fourth quarter and 8.7 percent for fi scal 2014
compared to fi scal 2013. Profi t results for the fourth quarter
were hampered by high meat input costs and reduced vol-
umes following related pricing actions. Partially offsetting
the decrease were higher equity in earnings results from
MegaMex in the fourth quarter, as fi scal 2013 included higher
incentive expense on the Fresherized Foods acquisition. For
fi scal 2014, improved margins of Hormel® bacon toppings and
the Herdez® line of salsas and sauces within MegaMex were
unable to offset the margin declines in products such as the
SPAM® family of products, Hormel® chili, Hormel® Compleats®
microwave meals, and Dinty Moore® stew.
Refrigerated Foods: Net sales for the Refrigerated Foods
segment increased 9.4 percent for the fi scal 2014 fourth quar-
ter and increased 9.2 percent for the year compared to fi scal
2013. Tonnage increased 0.6 percent for the fourth quarter
and decreased 0.1 percent for fi scal 2014 compared to fi scal
2013 results. Tonnage remained relatively even with fi scal
2013, as the Company successfully managed the reduced
volumes processed through its harvest facilities in the third
quarter due to PEDv in the industry and its effect on raw
material supplies.
Several value-added product lines within Refrigerated
Foods grew during fi scal 2014. Top-line results were driven
by double-digit sales growth within foodservice in both the